
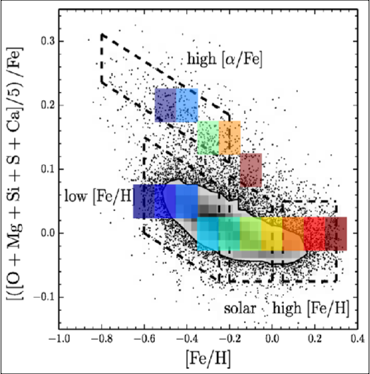
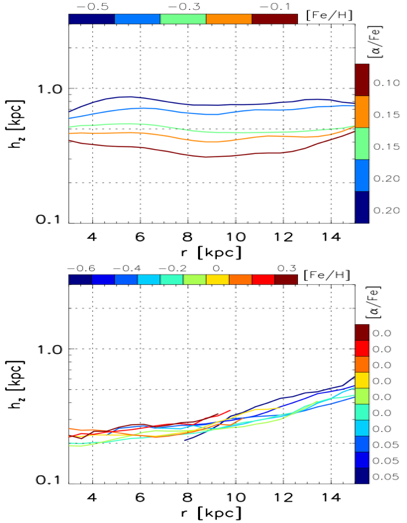
APOGEE sample composed of Red Clump giant stars in the range 4 < R < 14 kpc
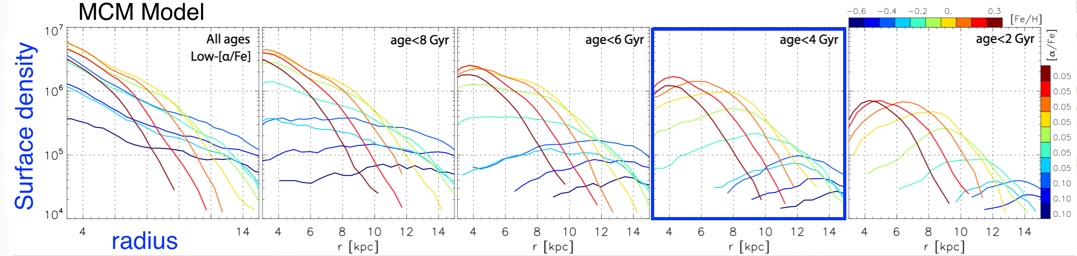
Minchev, Chiappini, & Martig (2013) model (MCM13) used to compare to APOGEE data
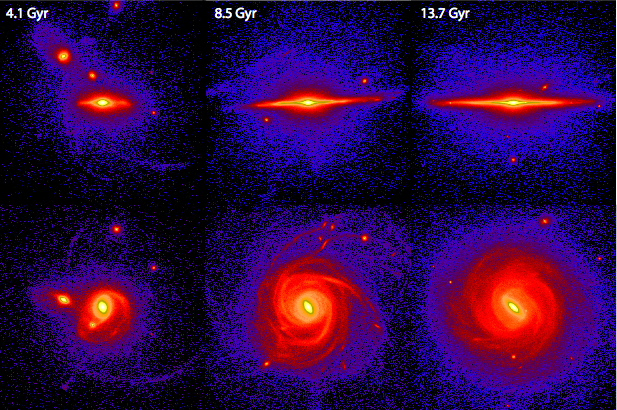
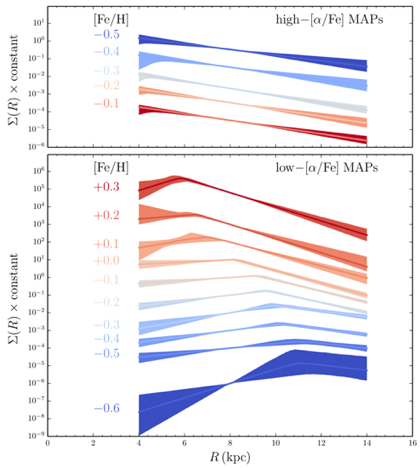
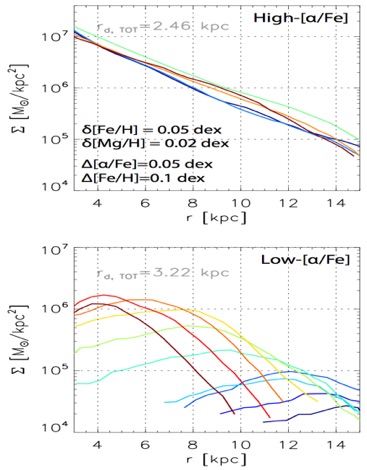
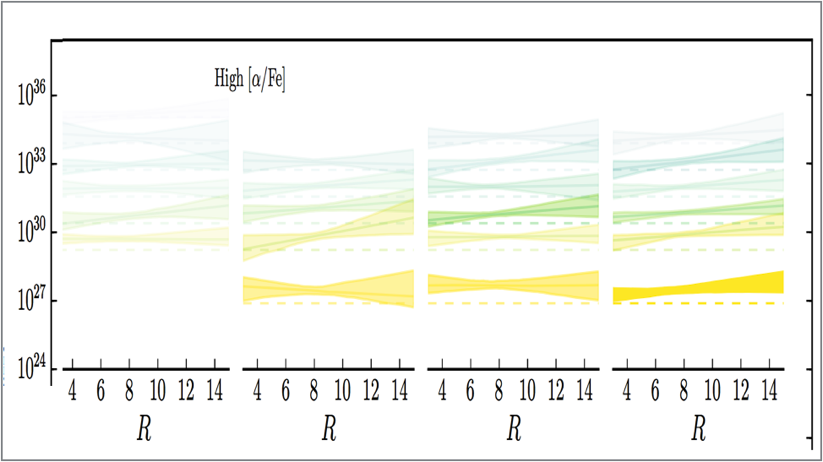
high-[α/Fe] MAPs
low-[α/Fe] MAPs

APOGEE Data
Model
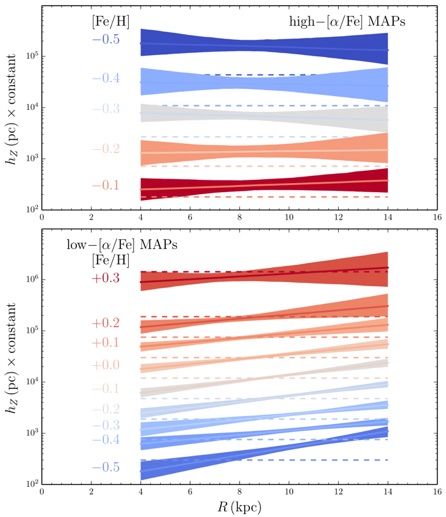
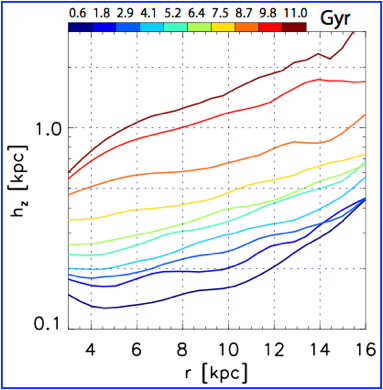
No flaring found in
high-[α/Fe] in both data and model
Flaring found in
high-[α/Fe] in both data and model
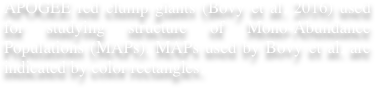
Simulation in cosmological context Martig et al. (2009, 2012)
Used for our chemo-dynamical model (Minchev, Chiappini & Martig 2013, 2014)
Stars born hot at high redshift:
Similar to
Brook et al. (2012),
Stinson et al. (2013),
Bird et al. (2013)
Bovy et al. (2016) found that surface density profiles of low-[α/Fe] MAPs were broken with the
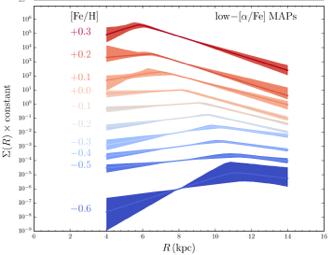
We first try to explain how one could get broken MAP density profiles
When all ages in model are considered surface density of model MAPs always decrease with radius - not a good match to APOGEE.
But when old stars are removed, peaks in surface density appear as in APOGEE data! As in the data, peaks shift to larger radius the lower the metallicity.
Best match happens at age < 4 Gyr and is consistent with the expectation that red clump giants peak in age around 2-4 Gyr (Bovy et al. 2016, Girardi 2016).

stellar sample age decreases

high-[α/Fe] MAPs
low-[α/Fe] MAPs
Single exponentials found for high-[α/Fe] surface density MAPs in both data and model
Broken surface density profiles found for low-[α/Fe] MAPs in both data and model
But, note that flaring is always present in mono-ages populations, although lost in high-[α/Fe] model MAPs above.
Why is that?


Match to APOGEE MAPs’ surface density variation with radius
Match to APOGEE MAPs’ scale-height variation with radius
APOGEE Data
Model
Bovy et al. (2016)
Bovy et al. (2016)
Bovy et al. (2016)
Bovy et al. (2016)

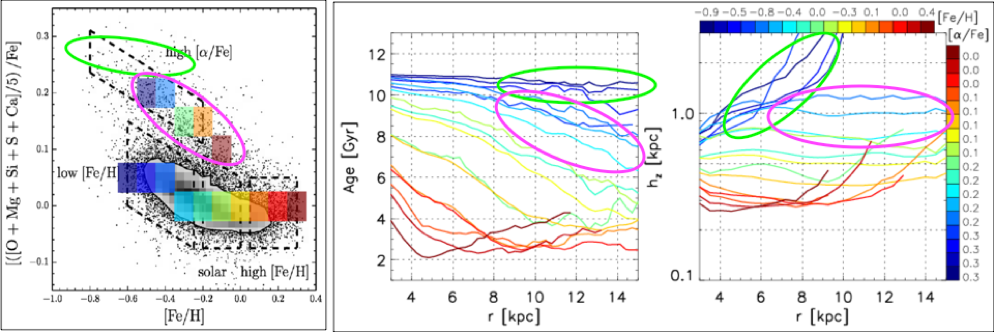
Negative age gradient of high-[α/Fe] MAPs causes the lack of flaring (indicated by magenta oval)
-
•Due to a mixture of ages, flaring in low-[α/Fe] MAPs not easily interpreted - increase in age with radius can causes flaring but that tells us nothing about the Milky Way evolution
-
•Note that APOGEE RC MAPs limited to [α/Fe] < 0.2 and [Fe/H] < 0.5 dex (magenta oval)
-
•We predict flaring in the highest [α/Fe], lowest [Fe/H] MAPs (green oval) - larger sample needed since not enough statistics at this time. This is where we expect MAPs are close to mono-age populations - see lack of age variation with radius in middle panel above and corresponding flared disks in right panel

Model
Data
vertical offset arbitrary
vertical offset reflects actual density of different MAPs
mono-age populations
Model
or, why we desperately need ages for doing Galactic Archaeology
While MAPs are also mono-age at high [a/Fe] and low [Fe/H], because of the inside-out disk formation a negative gradient typically results for a given MAP. This makes it dangerous to interpret the disk structure of MAPs in terms of disk formation and evolution.
A great deal about the disk chemical evolution can be learned by studying mono-age populations of MAPs, but in any case, the availability of good ages is a must in Galactic Archaeology studies!
APOGEE mono-age populations show flaring in old stars!
Mackereth et al. (2017)

Minchev et al. (2016)

Mackereth et al. (2017) showed that when APOGEE RC data are binned by age (Martig et al. 2016), flaring does appear, consistent with our model predictions.
-
More recently the Bovy et al. (2016) study was redone but using age instead of [α/Fe]