April 26 2004
Finite size scaling of triangular lattices f=1/49 at T=0.005
The labels of k1 and k2 in this page
are the orthogonal
coordinates in the structure function space, not the wave numbers based on the
reciprocal lattice b=(b1,b2).
E=0.1
The simulation results are at April 18 2004
.
Labeling of peaks
The peaks are labeled as shown in the following picture:
 |
| Label |
k1 |
k2 |
dk=sqrt(k1*k1
+ k2*k2) |
dk / d1 |
| 1 |
0 |
1/3Pi (1.0364567796) |
1.0364567796 |
1 |
| 2 |
0 |
2/3Pi (2.0729135591) |
2.0729135591 |
2 |
| 3 |
0 |
Pi (3.1093703387) |
3.1093703387 |
3 |
| 4 |
2/7Pi (0.89759790103) |
1/6Pi (0.51822838978) |
1.0364567796 |
1 |
|
| 5 |
4/7Pi (1.7951958021) |
1/3Pi |
2.0729135592 |
2 |
| 6 |
6/7Pi (2.6927937031) |
1/2Pi (1.5546851693) |
3.1093703387 |
3 |
| 7 |
4/7Pi |
0 |
1.7951958021 |
12/7 |
| 8 |
2/7Pi |
1/2Pi |
1.7951958021 |
12/7 |
| 11 |
6/7Pi |
1/6Pi |
2.7422068834 |
18/7 |
|
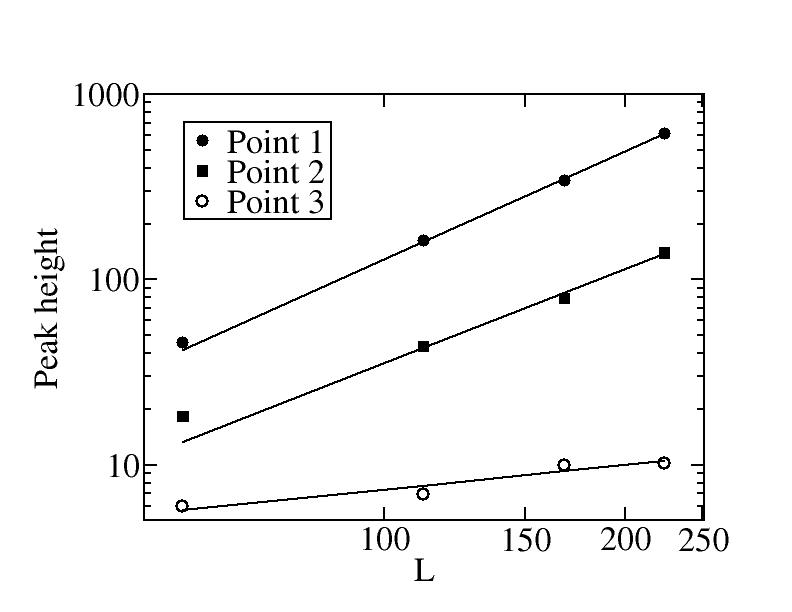
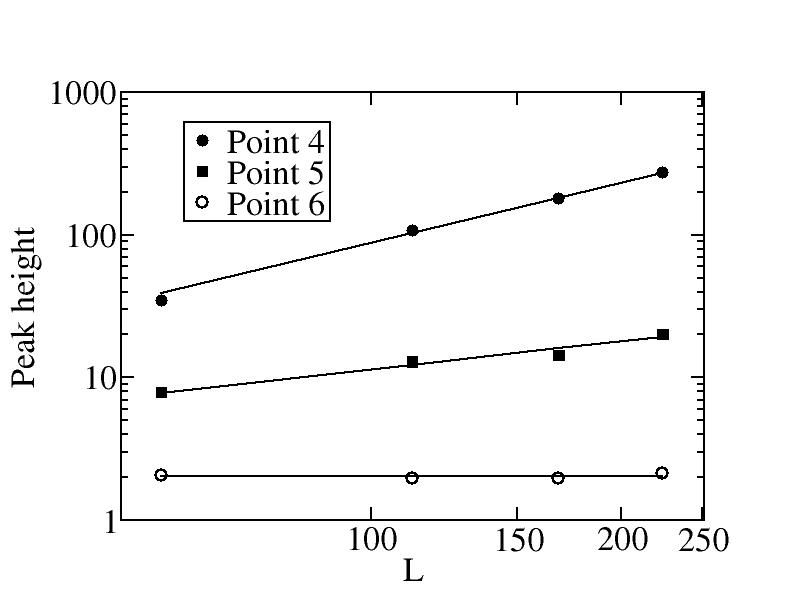
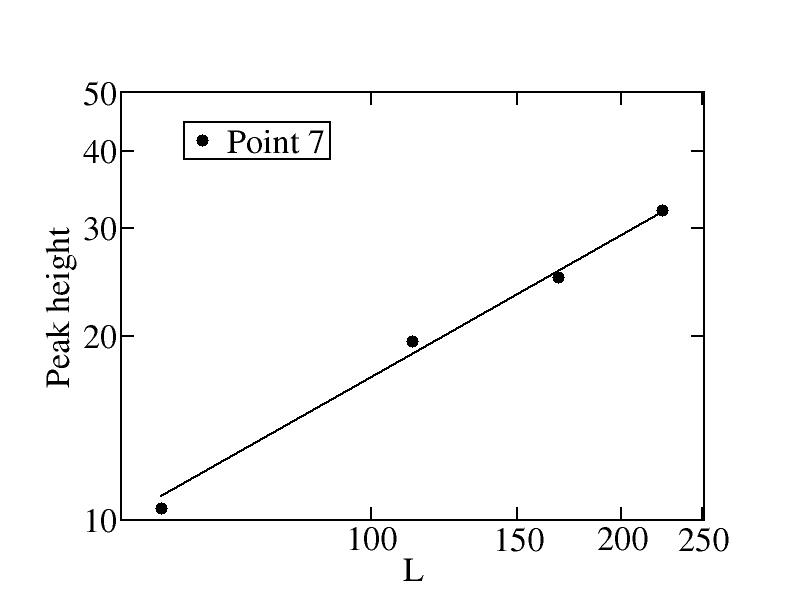
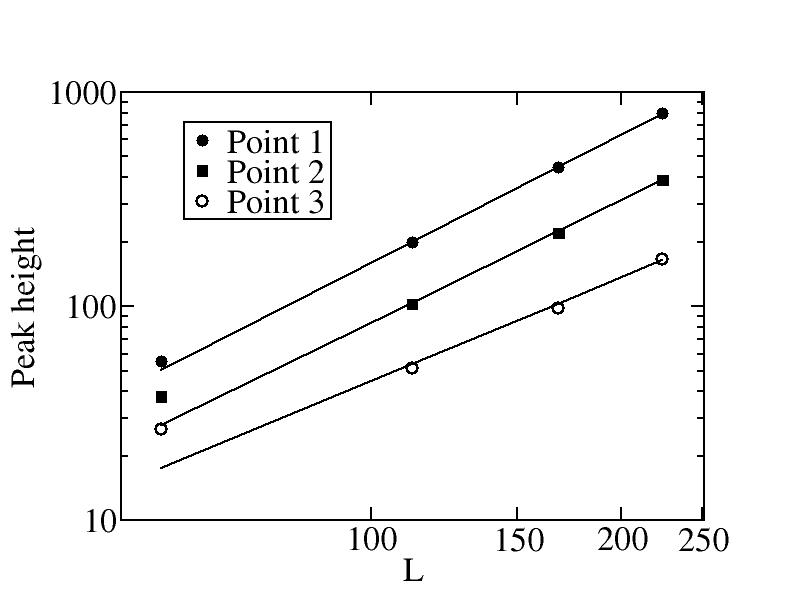
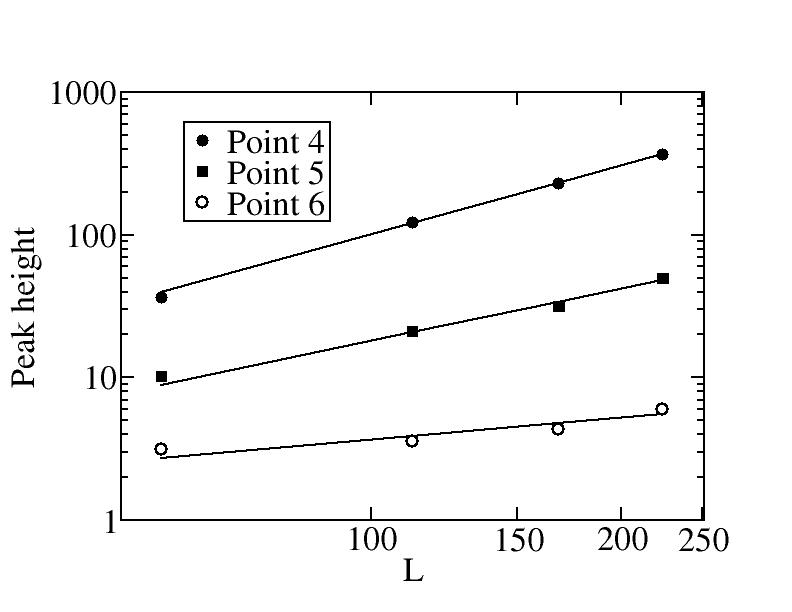
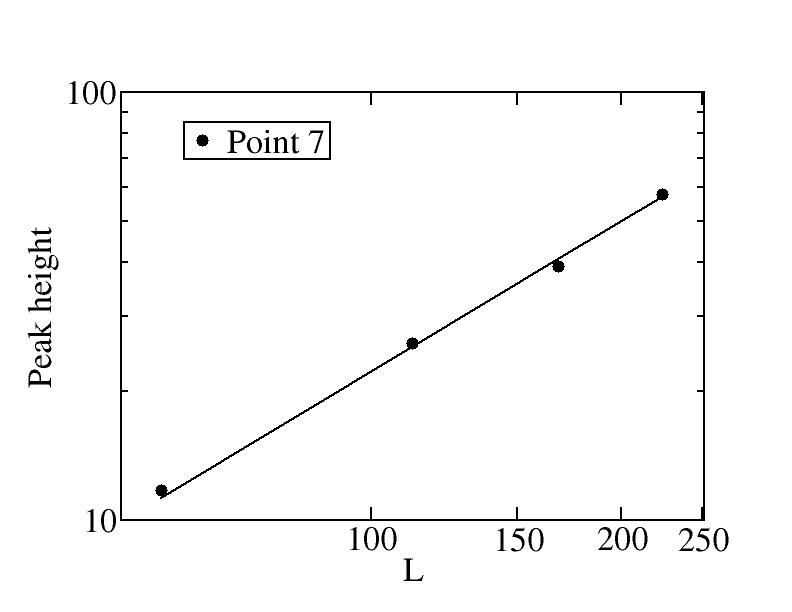
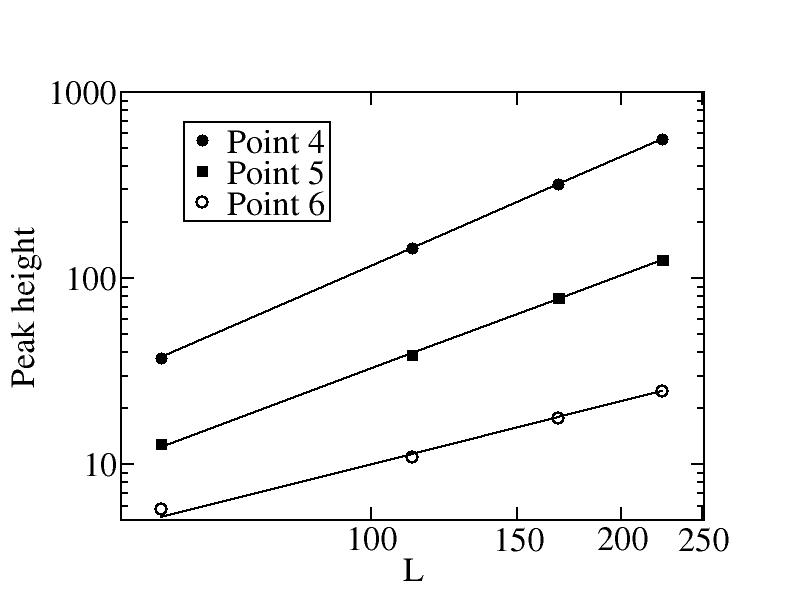
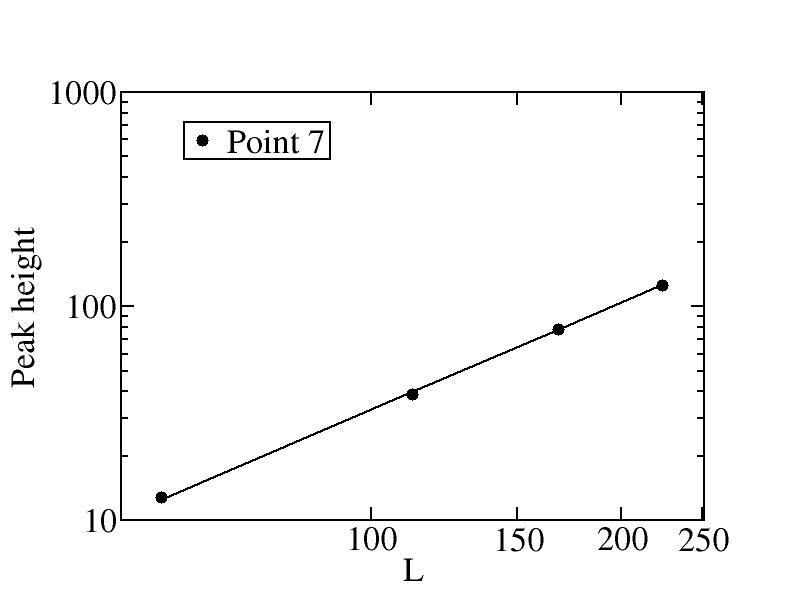
Log-Log plot of peak heights
The peak heights are fit by H = H0 L ^ ( 2 - Ak).
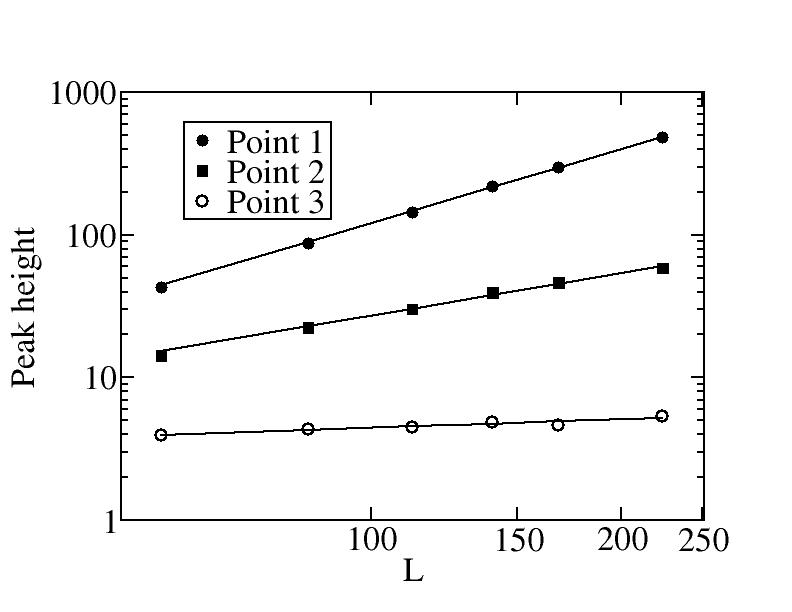
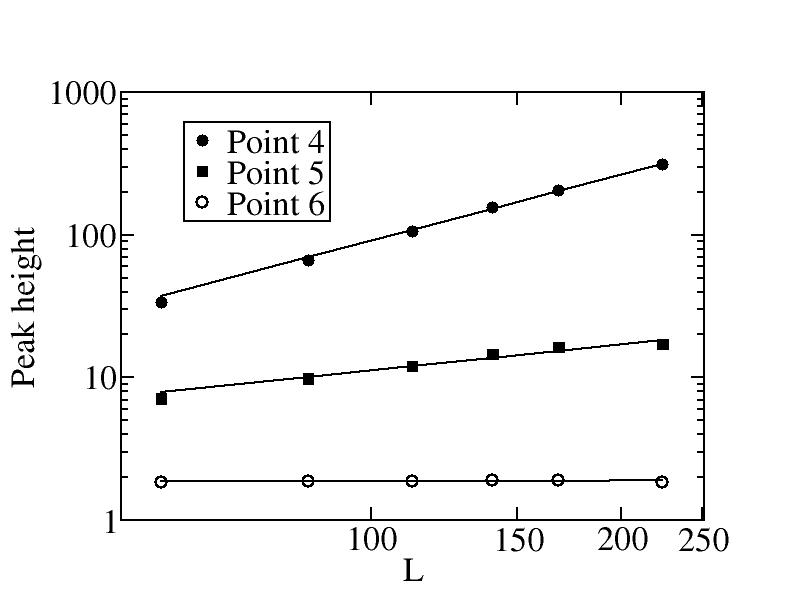
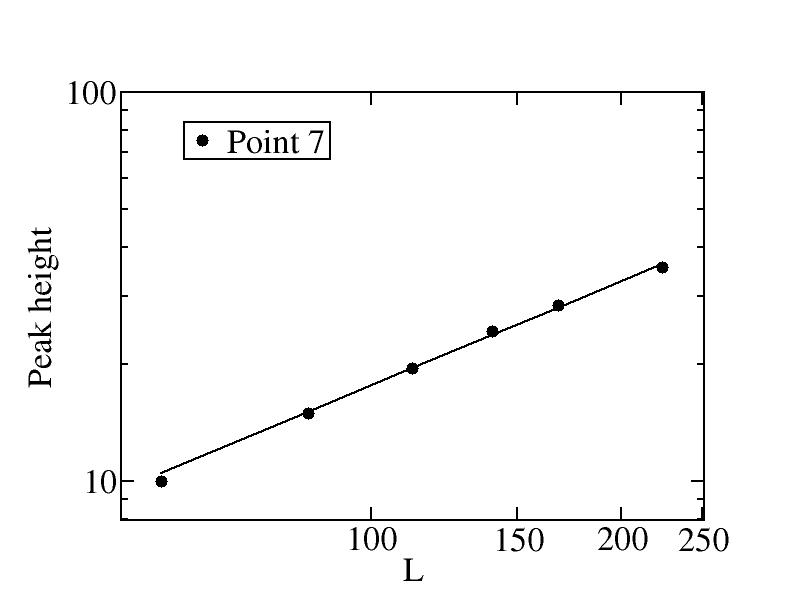
The fitted values are:
| Parameter |
Point 1 |
Point 2 |
Point 3 |
Point 4 |
Point 5 |
Point 6 |
Point 7 |
| H0 |
0.0442603 |
0.300286 |
1.76738 |
0.0762866 |
0.688684 |
1.78499 |
0.295279 |
| Ak |
0.281669 |
1.02133 |
1.80014 |
0.462303 |
1.3944 |
1.98836 |
1.11211 |
To evaluate the deviation of Ak from equilibrium float solid
case, we compute
B1 = Ak ( d1 / dk )2.
| |
Point 1 |
Point 2 |
Point 3 |
Point 4 |
Point 5 |
Point 6 |
Point 7 |
| B1 |
0.281669 |
0.255333 |
0.200016 |
0.462303 |
0.348600 |
0.220929 |
0.378426 |
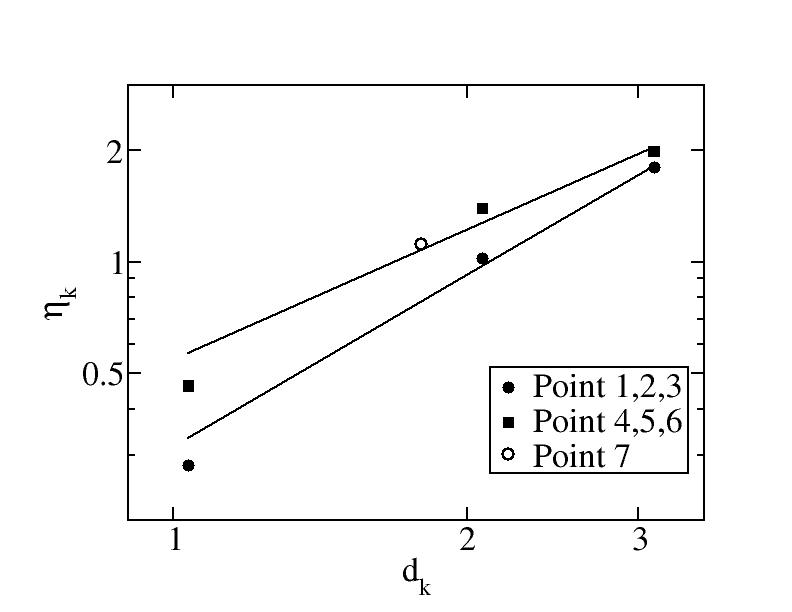
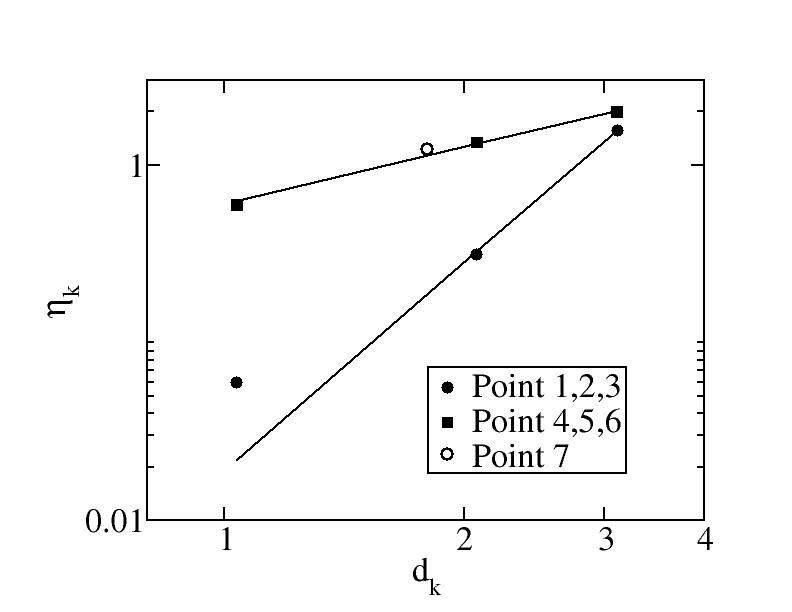
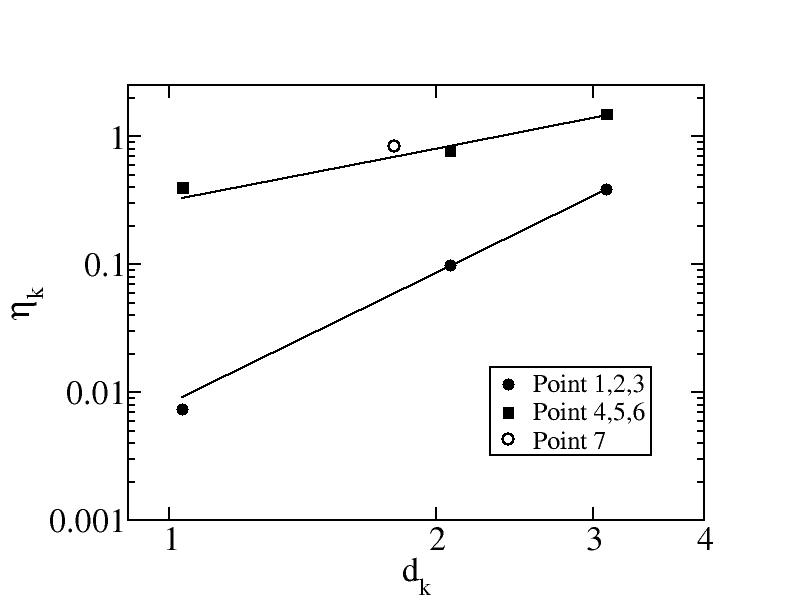
Plot of fit parameter Ak
The abover parameter values Ak have been fitted by
Ak=A0dkr. The values for
point 1,2,3 are A0=0.316204, r=1.54119. Those for point 4,5,6
are A0=0.542514, r=1.16643.
E=0.2
The simulation results are at
May 01 2004. The second run of L=112 has been used.
Log-Log plot of peak heights
The peak heights are fit by H = H0 L ^ ( 2 - Ak).
The fitted values are:
| Parameter |
Point 1 |
Point 2 |
Point 3 |
Point 4 |
Point 5 |
Point 6 |
Point 7 |
| H0 |
0.0168089 |
0.0151078 |
0.95807 |
0.137418 |
0.553069 |
1.97377 |
0.488833 |
| Ak |
0.0597787 |
0.316067 |
1.55833 |
0.596852 |
1.34369 |
1.99347 |
1.22793 |
Plot of fit parameter Ak
The abover parameter values Ak have been fitted by
Ak=A0dkr. The values for
point 1,2,3 are A0=0.0191003, r=3.87958. Those for point 4,5,6
are A0=0.602414, r=1.06167.
E=0.28
The simulation results are at
May 02 2004.
Log-Log plot of peak heights
The peak heights are fit by H = H0 L ^ ( 2 - Ak).
The fitted values are:
| Parameter |
Point 1 |
Point 2 |
Point 3 |
Point 4 |
Point 5 |
Point 6 |
Point 7 |
| H0 |
0.0164558 |
0.0131147 |
0.0267984 |
0.0628677 |
0.0622811 |
0.350681 |
0.103151 |
| Ak |
0.0073707 |
0.0980165 |
0.389463 |
0.398437 |
0.76976 |
1.48844 |
0.833524 |
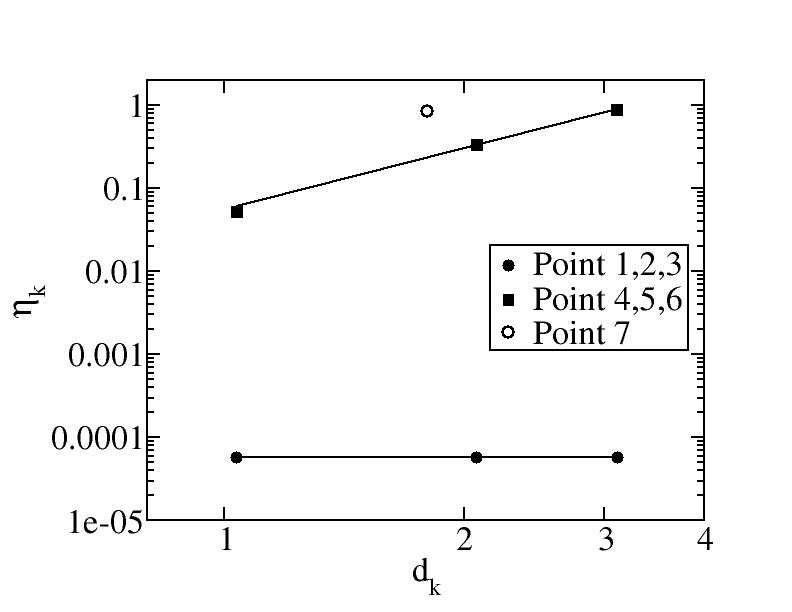
Plot of fit parameter Ak
The abover parameter values Ak have been fitted by
Ak=A0dkr. The values for
point 1,2,3 are A0=0.00809728, r=3.41445. Those for point 4,5,6
are A0=0.31348, r=1.35722.
E=0.4
The simulation results are at
May 04 2004.
Log-Log plot of peak heights
The peak heights are fit by H = H0 L ^ ( 2 - Ak).

The fitted values are:
| Parameter |
Point 1 |
Point 2 |
Point 3 |
Point 4 |
Point 5 |
Point 6 |
Point 7 |
| H0 |
0.0203877 |
0.0203877 |
0.0203877 |
0.0147965 |
0.0151877 |
0.0585157 |
0.0152019 |
| Ak |
0 |
0 |
0 |
0.0520818 |
0.333823 |
0.883244 |
0.333722 |
Plot of fit parameter Ak
The abover parameter values Ak have been fitted by
Ak=A0dkr. The values for
point 1,2,3 are A0=0, r=0. Those for point 4,5,6
are A0=0.0558114, r=2.43543.
E=2.0
The simulation results are at
May 05 2004.
Log-Log plot of peak heights
The peak heights are fit by H = H0 L ^ ( 2 - Ak).
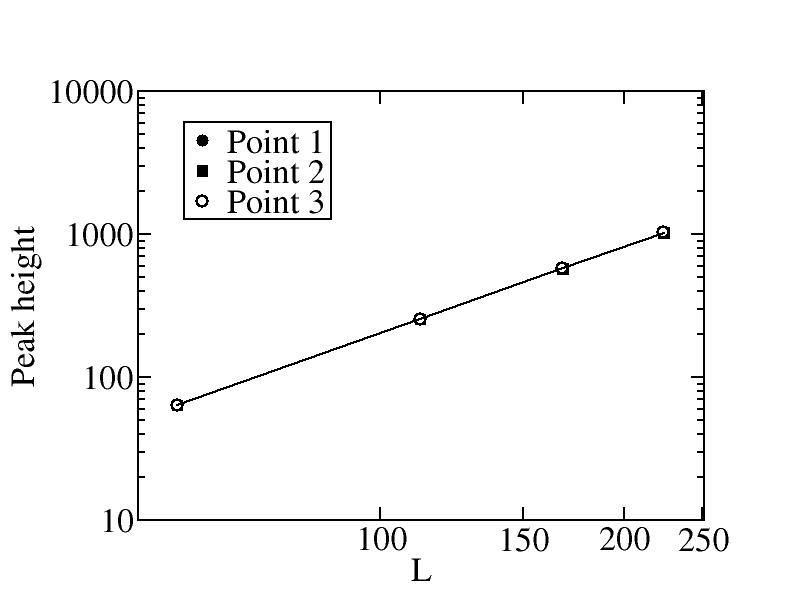

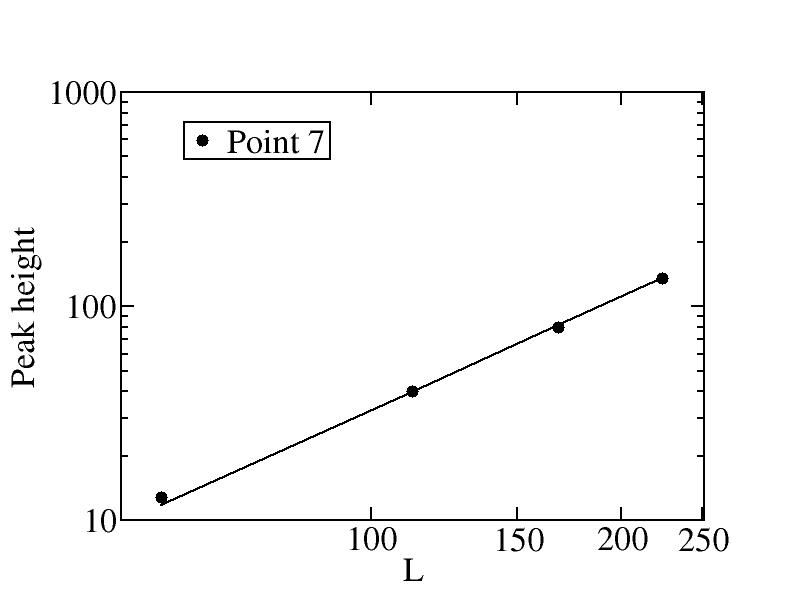
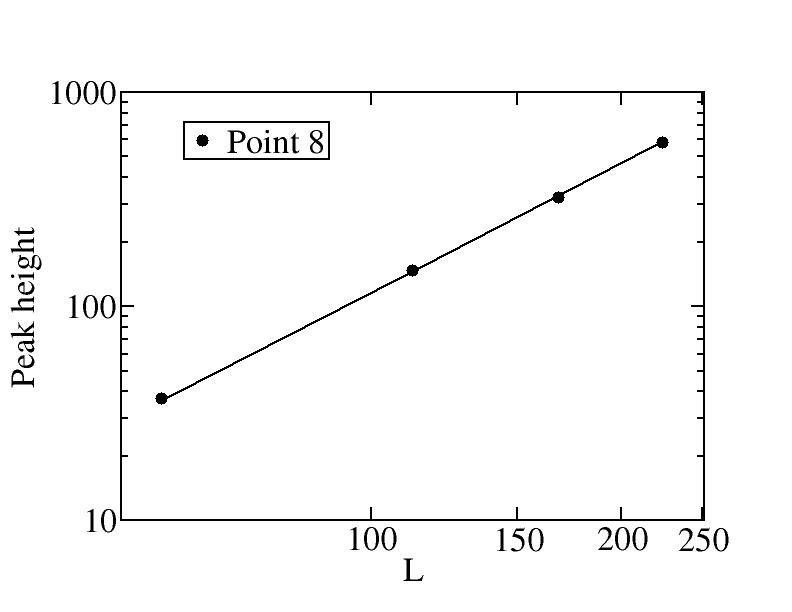
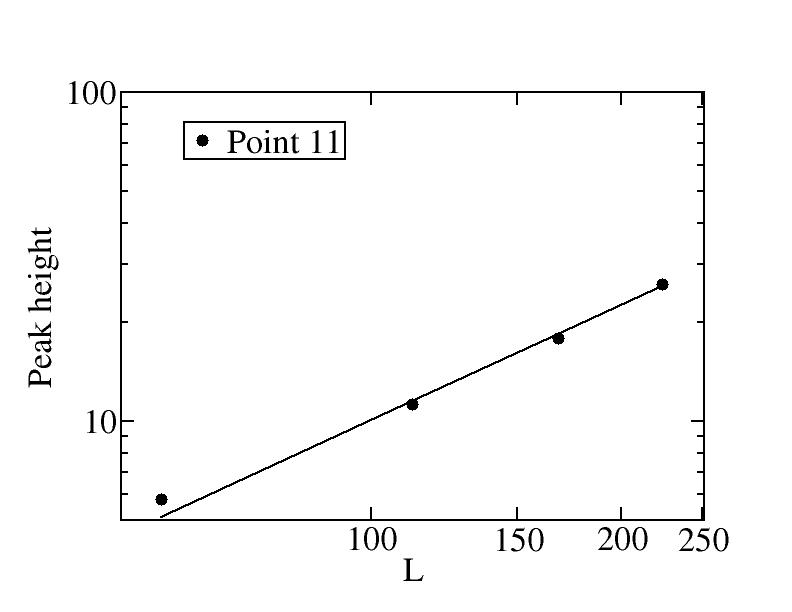
The fitted values are:
| Parameter |
Point 1 |
Point 2 |
Point 3 |
Point 4 |
Point 5 |
Point 6 |
Point 7 |
Point 8 |
Point 11 |
| H0 |
0.0204082 |
0.0204082 |
0.0204082 |
0.0110128 |
0.00968585 |
0.0474475 |
0.00968585 |
0.0110128 |
0.0474475 |
| Ak |
0 |
0 |
0 |
-0.0100777 |
0.236641 |
0.835942 |
0.236641 |
-0.0100777 |
0.835942 |
To evaluate the deviation of Ak from equilibrium float solid
case, we compute
B1 = Ak ( d1 / dk )2.
| |
Point 1 |
Point 2 |
Point 3 |
Point 4 |
Point 5 |
Point 6 |
Point 7 |
Point 8 |
Point 11 |
| B1 |
0 |
0 |
0 |
-0.0100777 |
0.05916025 |
0.092882444444 |
0.080523673611 |
-0.0034292173611 |
0.12642332716 |