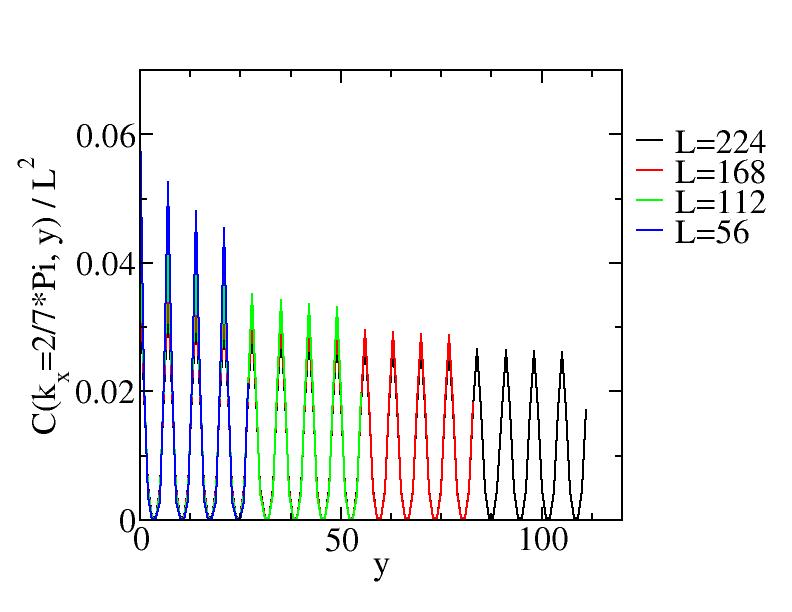
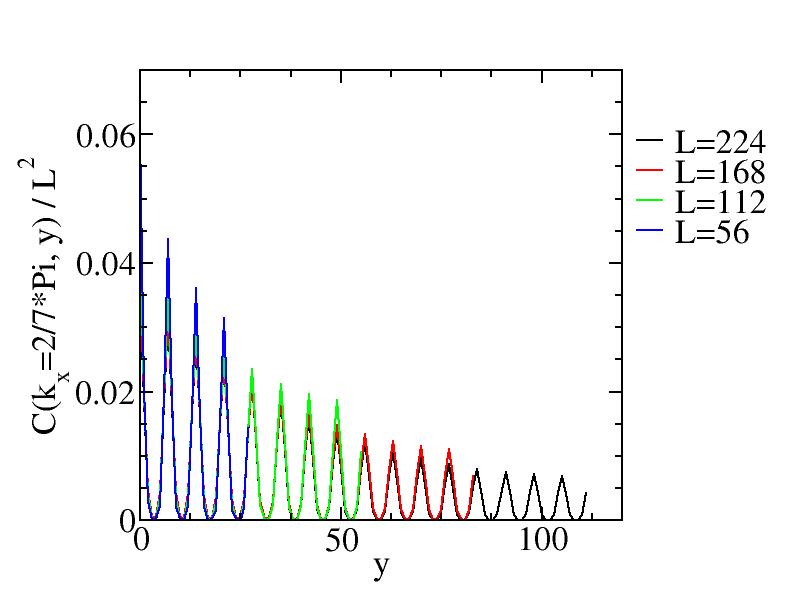
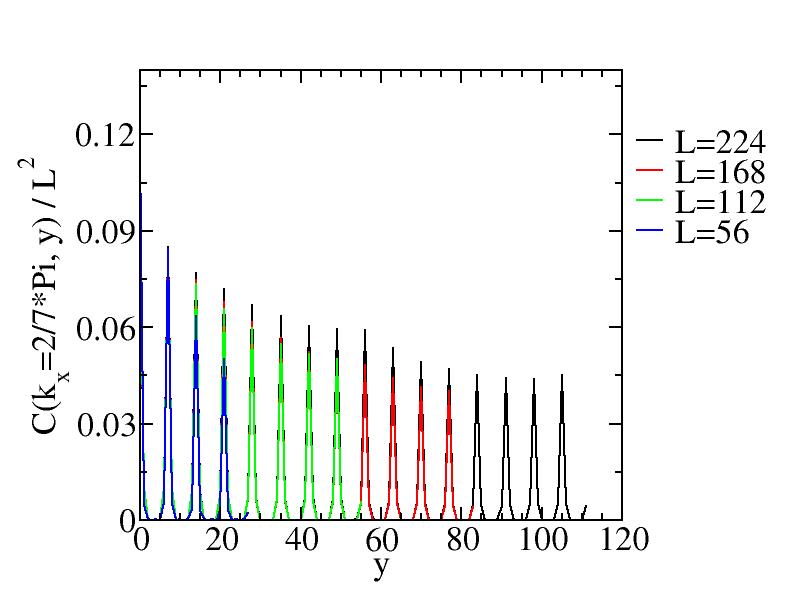
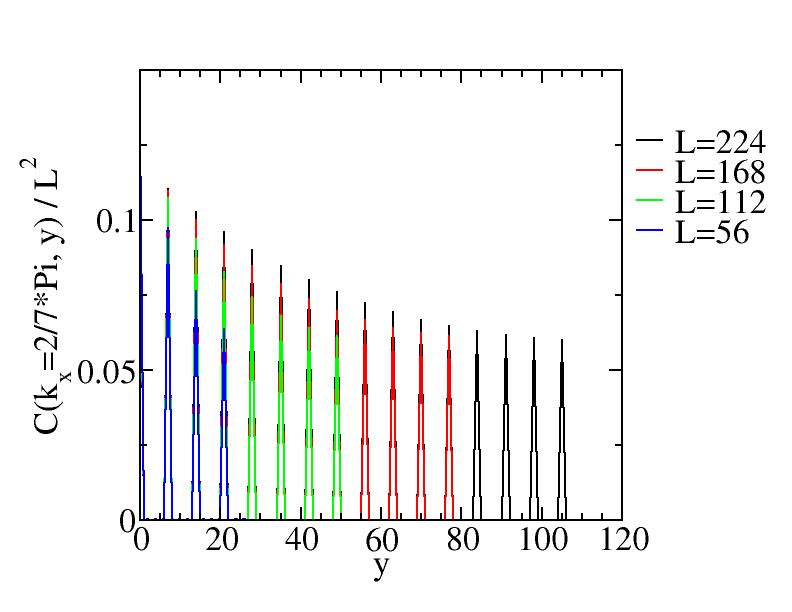
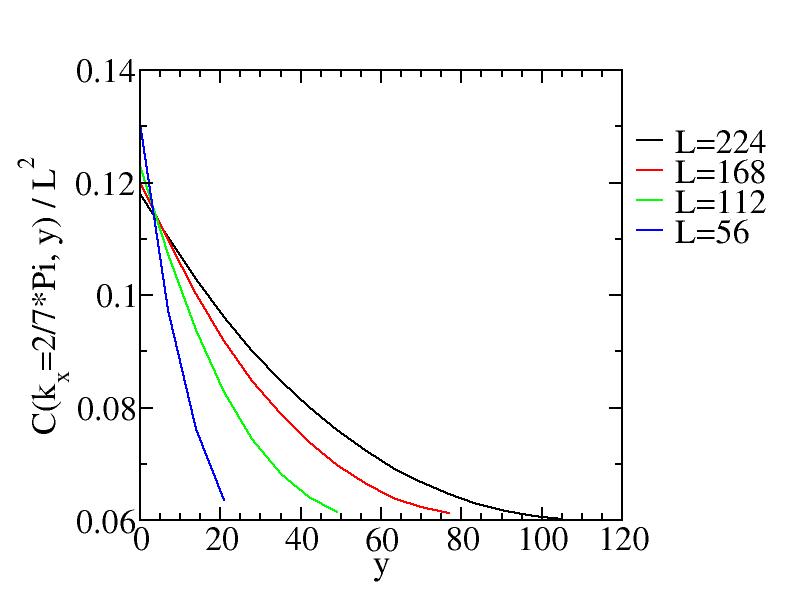
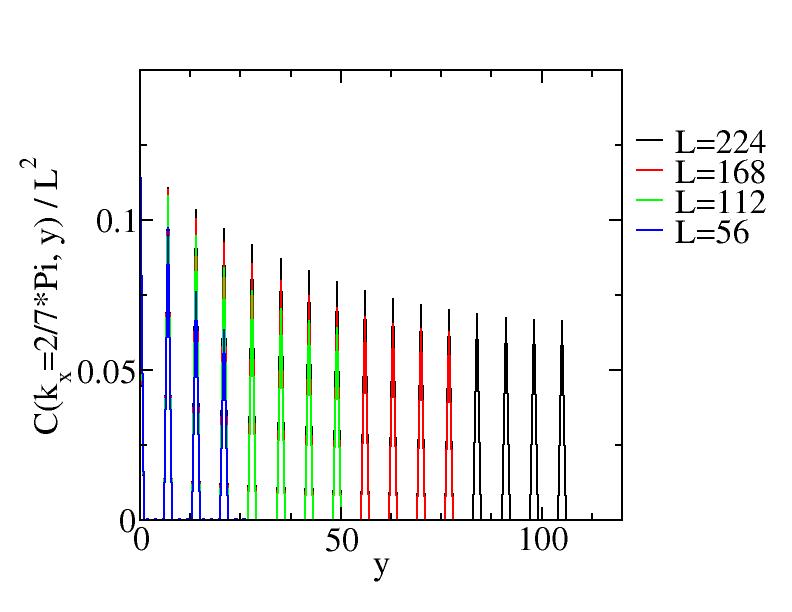
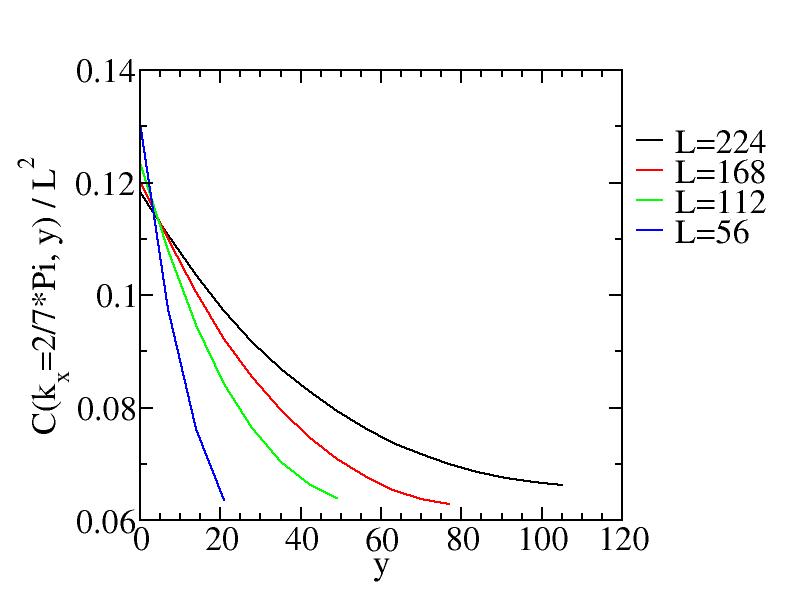
In order to get the contour plot, the function C has been sampled every 7 spaces along y and the negative peaks have changed their signs.