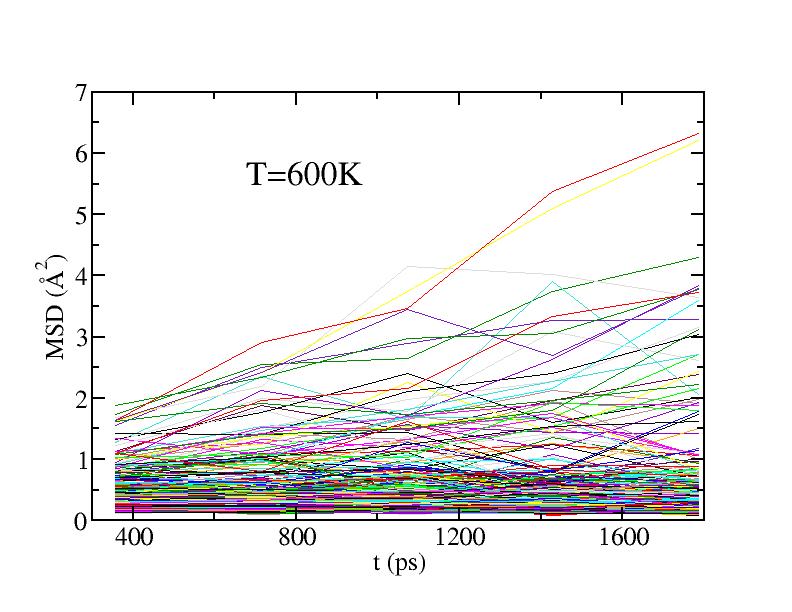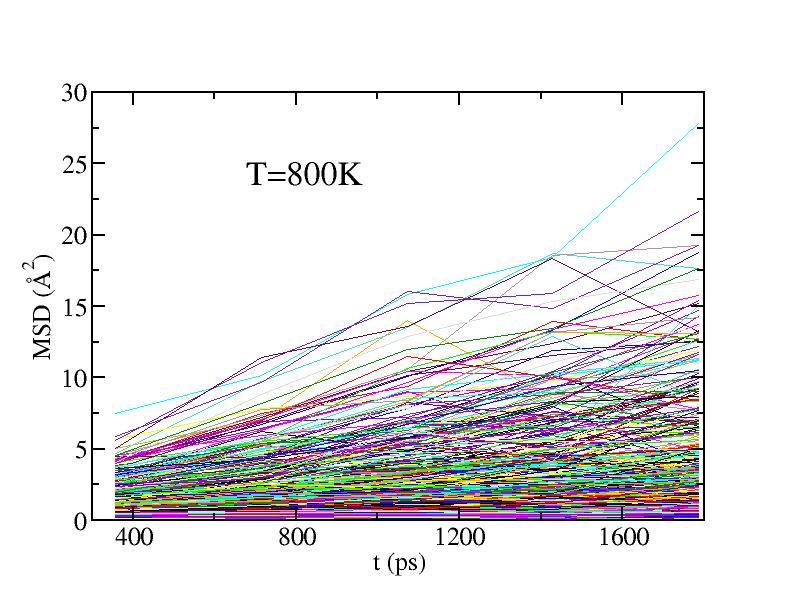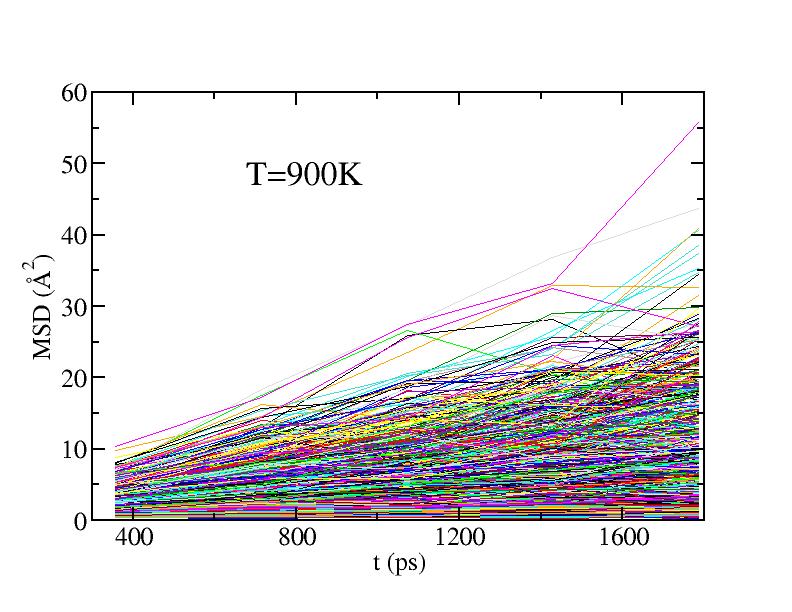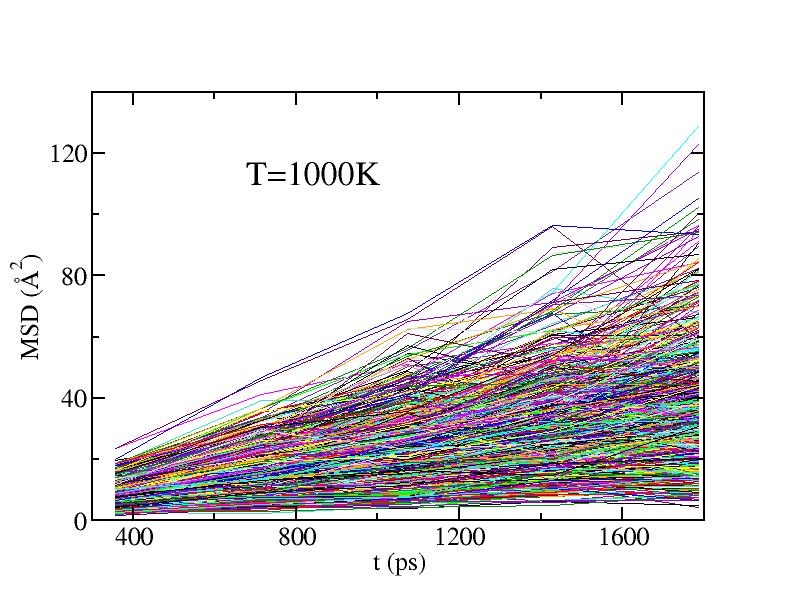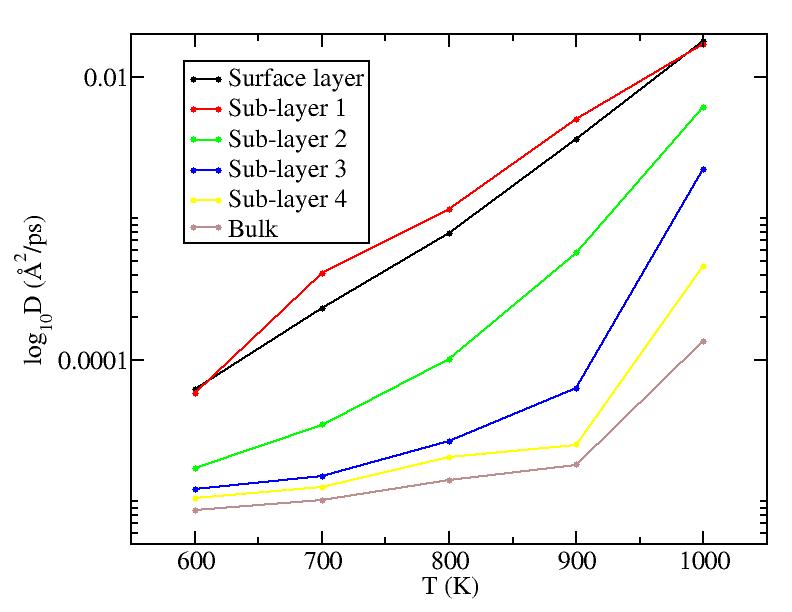
Diffusion coefficients were evaluated by fit the plots of MSD to a straight line centered at (0,0). The first 2500ps data have been discarded.
The positions of atoms have been tracked. Whenever an atom has an MSD larger than 4.5*4.5 Angstrom^2, it is marked as "moved".

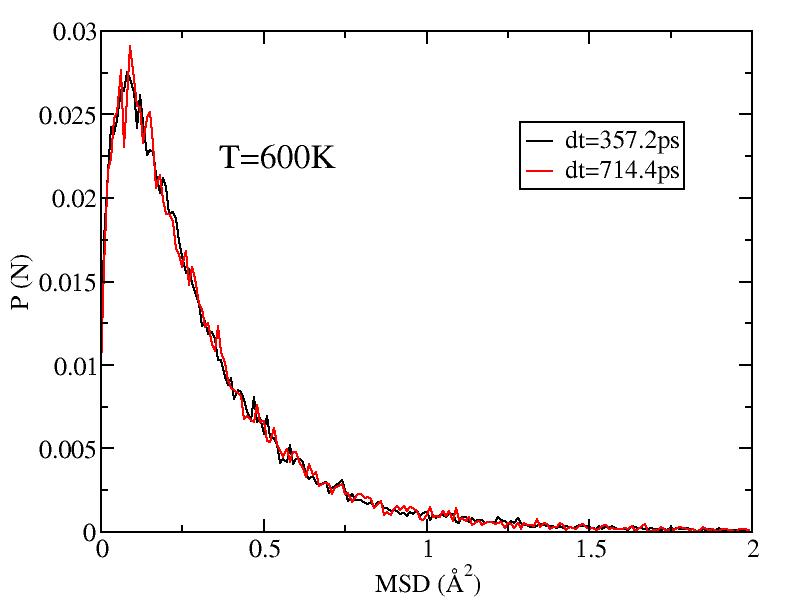
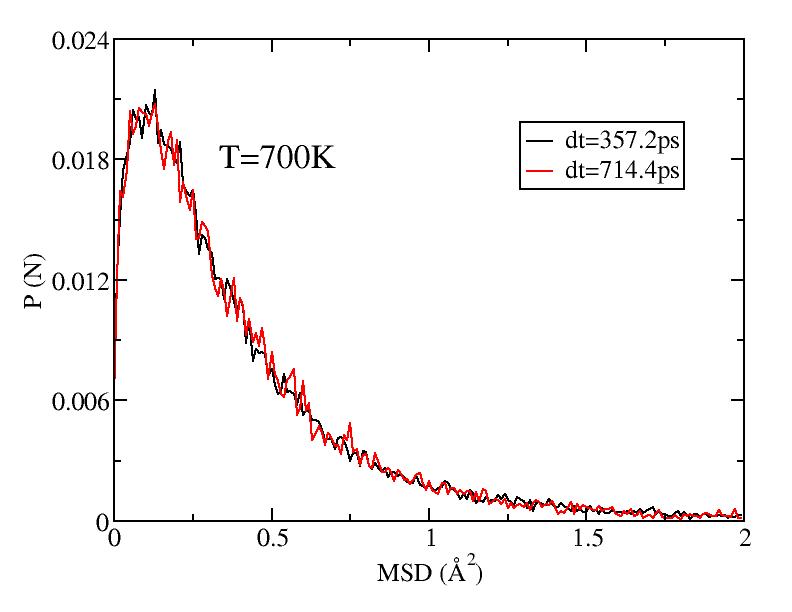
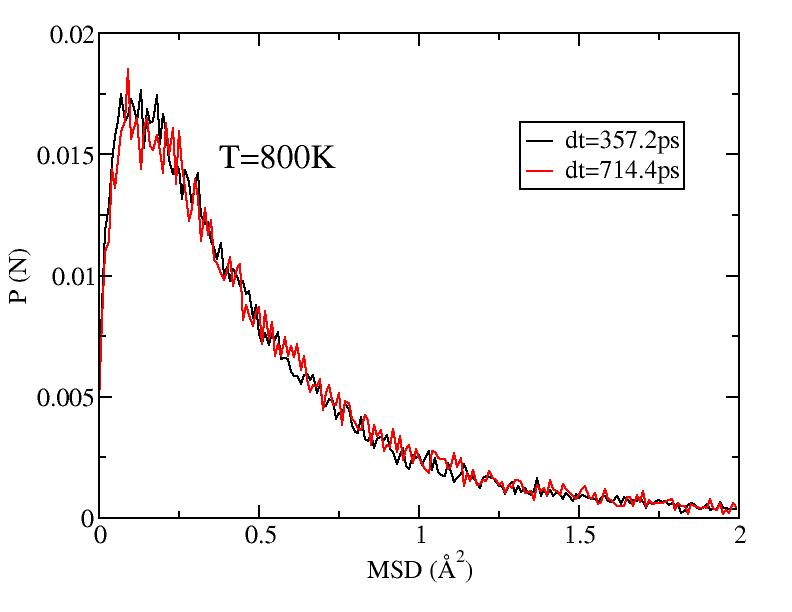
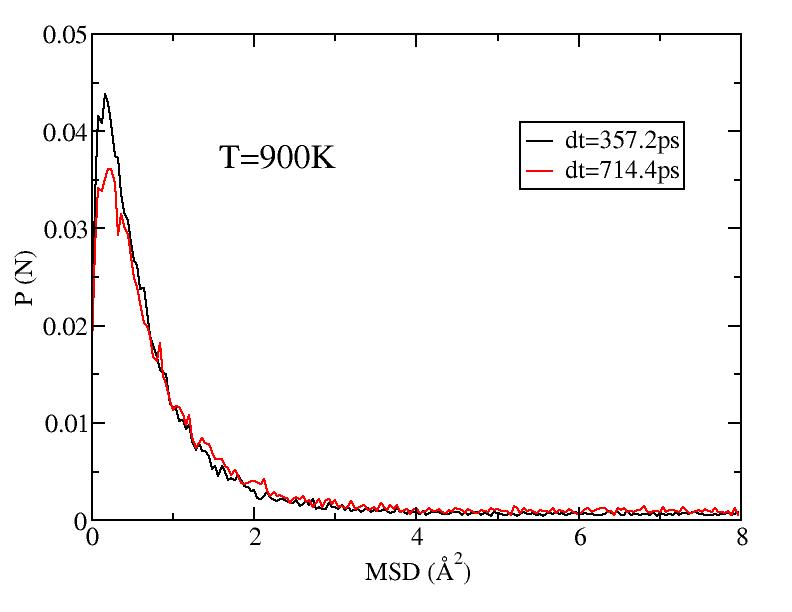
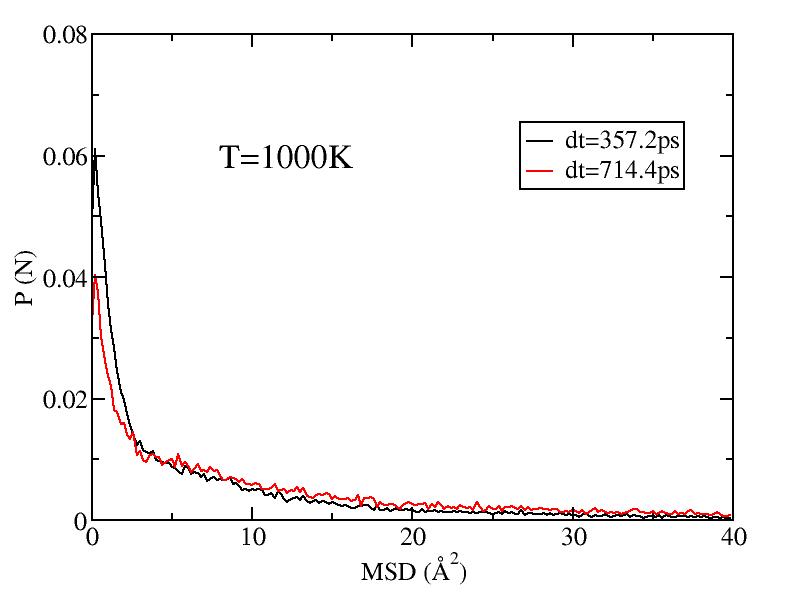
The mean square displacements of two configurations with time interval of 357.2ps (10 configurations) or 714.4ps (20 configurations) have been calculated and accumulated (46 or 23 groups of independent data) for surface atoms. The histograms (1000 bins) of number of atoms according to MSD have been normalized. The plots are only part of the whole histograms.