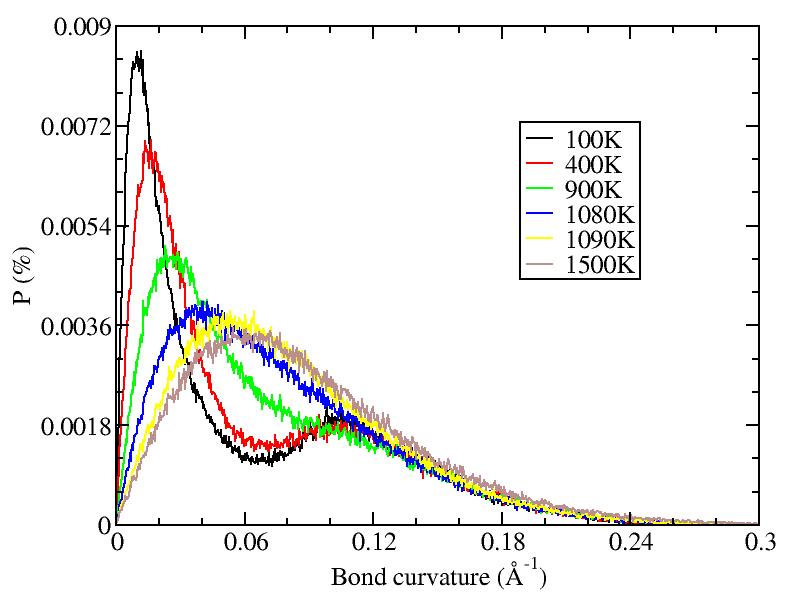
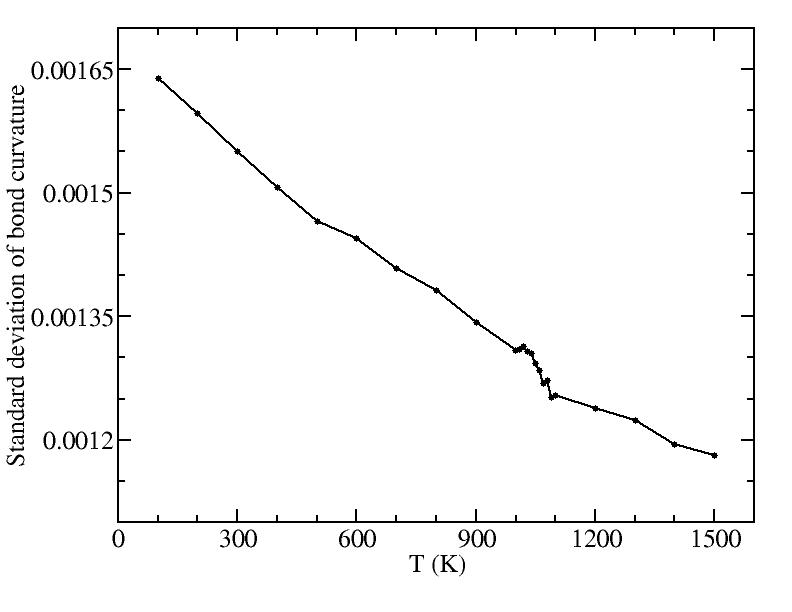
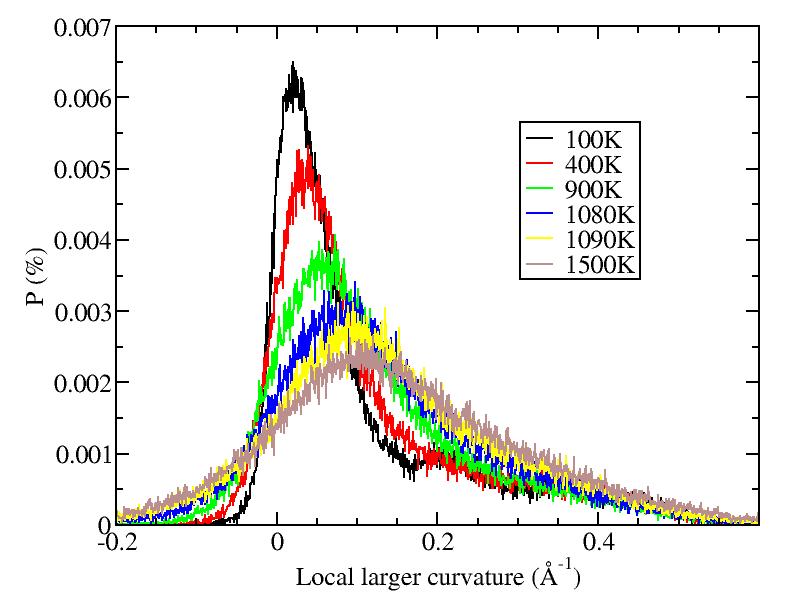
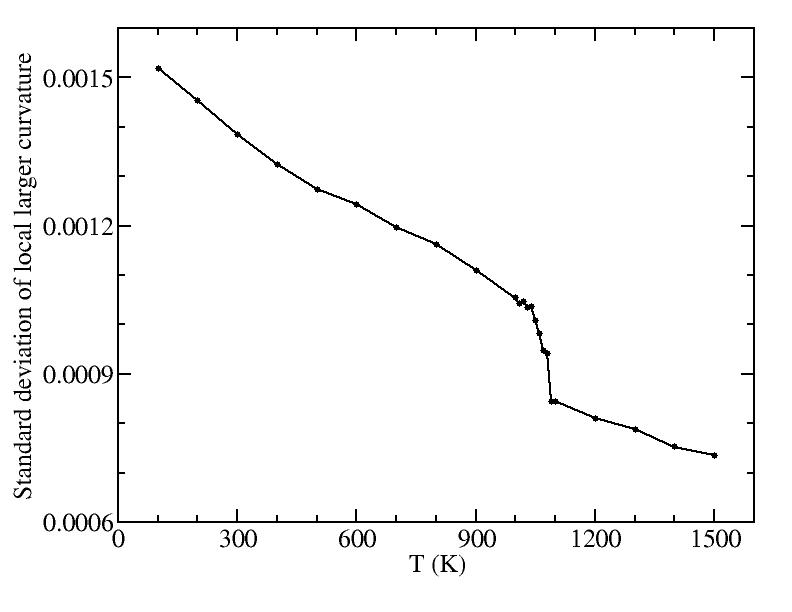
I don't know if we can still say the faceting transition is second order since the standard deviations reduce quickly around melting temperature. Both plots show the onset temperature of standard-deviation changing is 1040K (close to the changing temperature of bond order parameters of surface layer). There is a big jump between 1080K and 1090K, where melting resides.
There is a small plateau between 1070K and 1080K, just befor the melting. Can it be mapped to the intermediate meta-stable state of gold nanorods?