


At 1075K, the system keeps solid for 610 configurations and became liquid for 390 configurations. So we treat the two situations seperately as "1075K solid" and "1075K liquid".
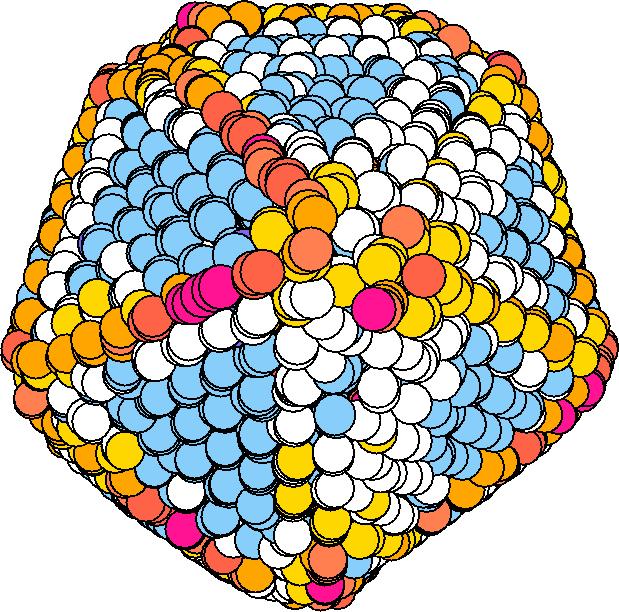
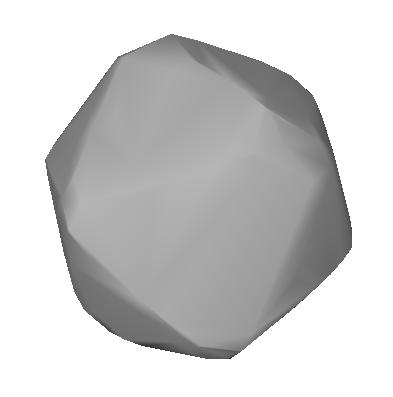
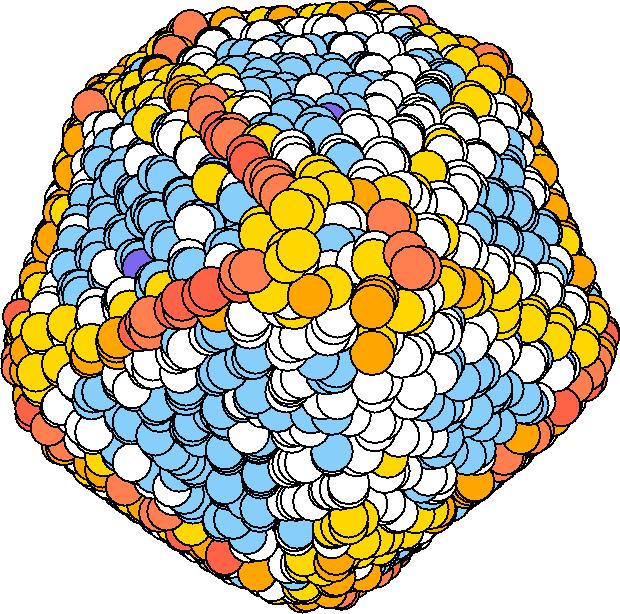
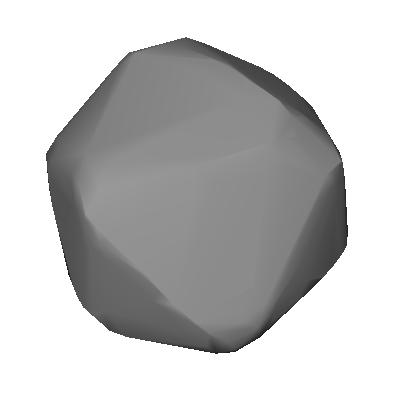
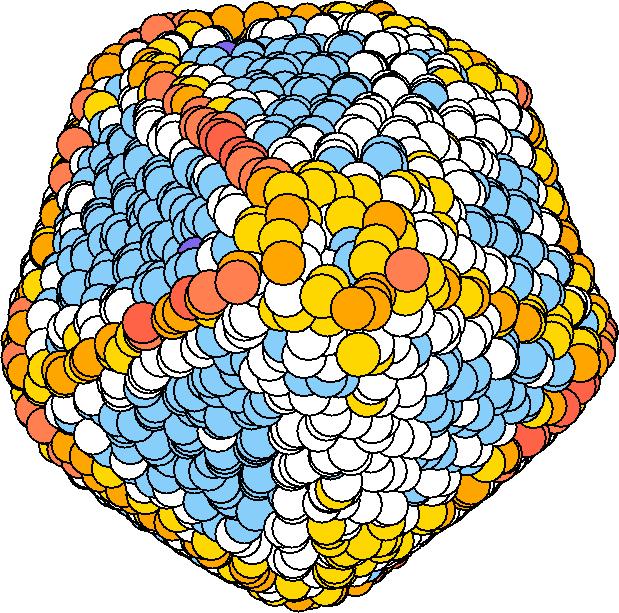
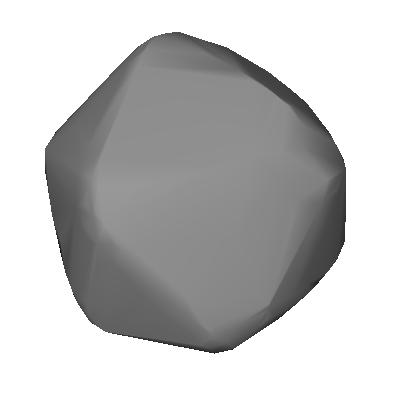
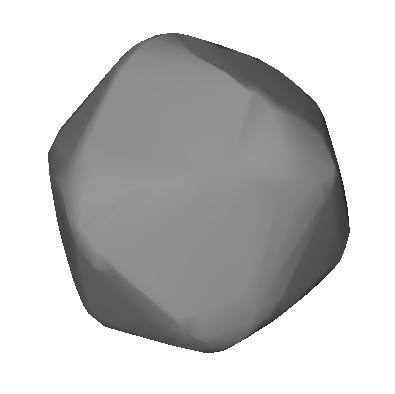
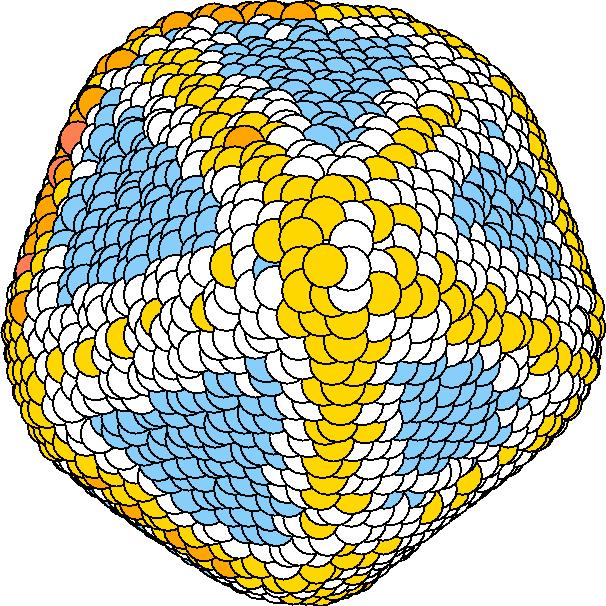
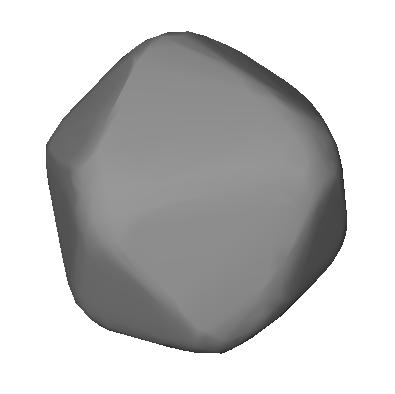
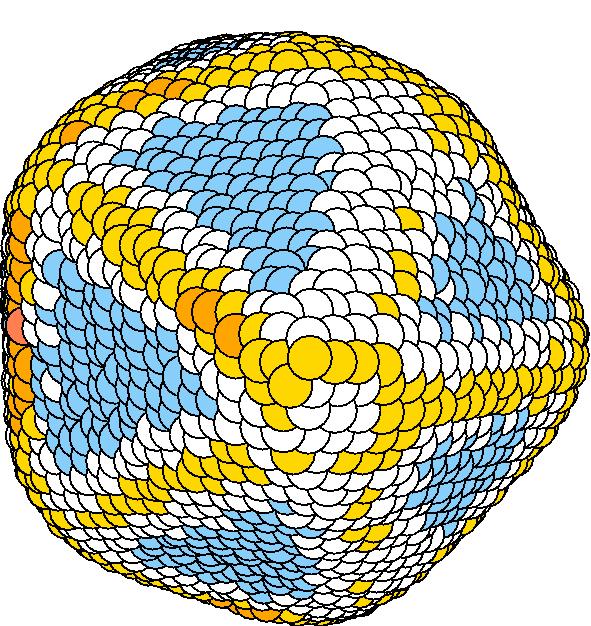
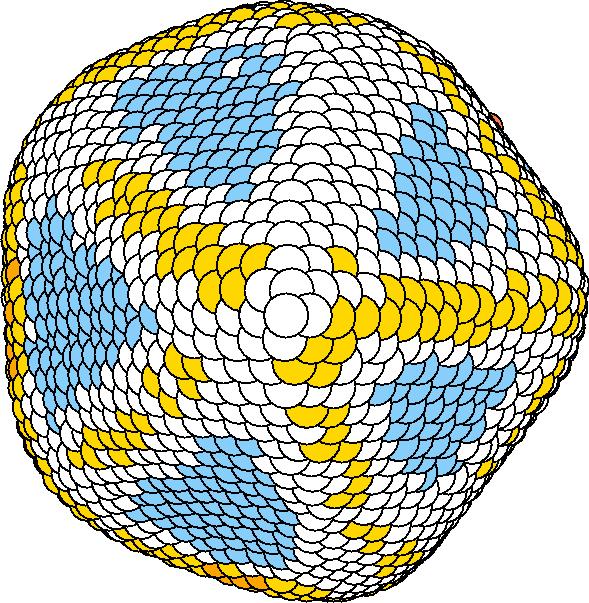
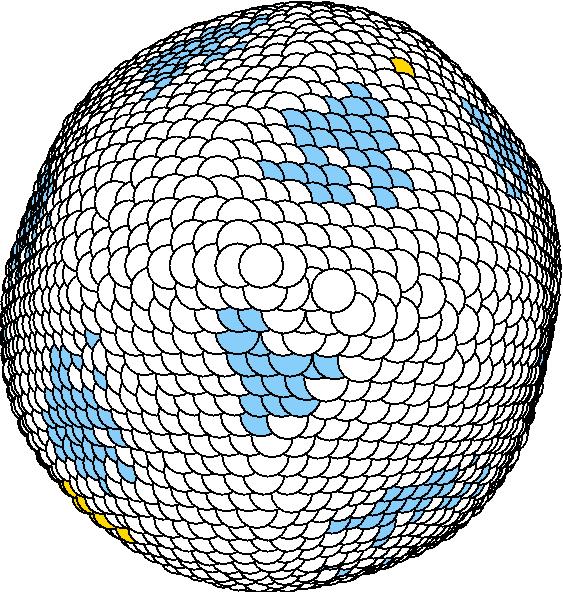
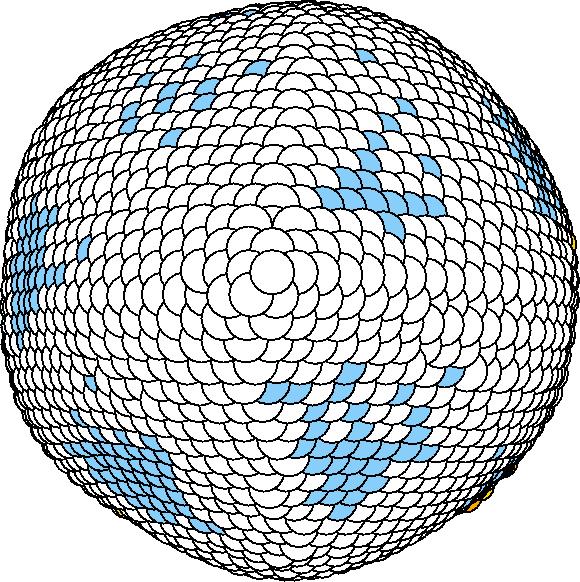
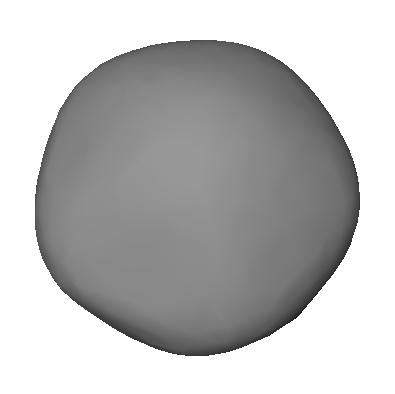
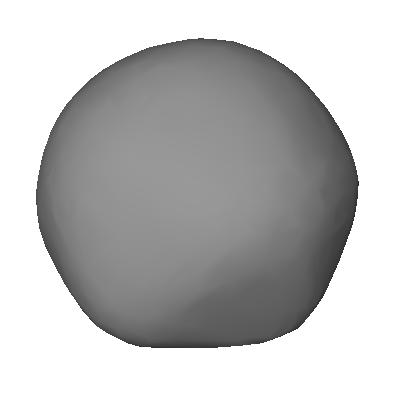
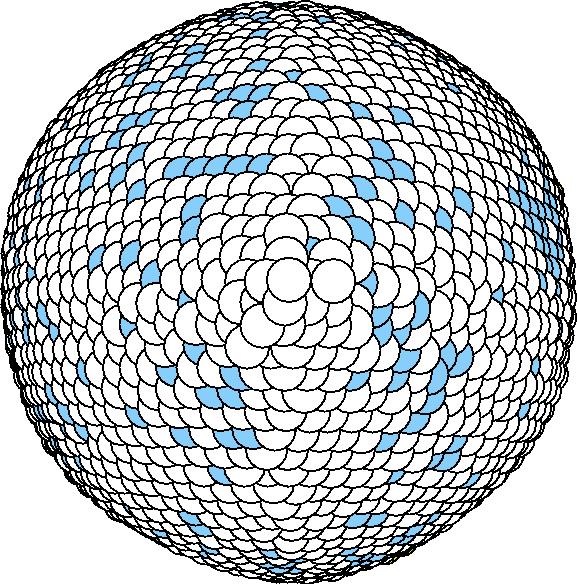
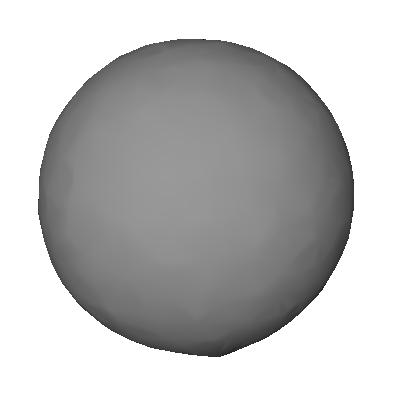
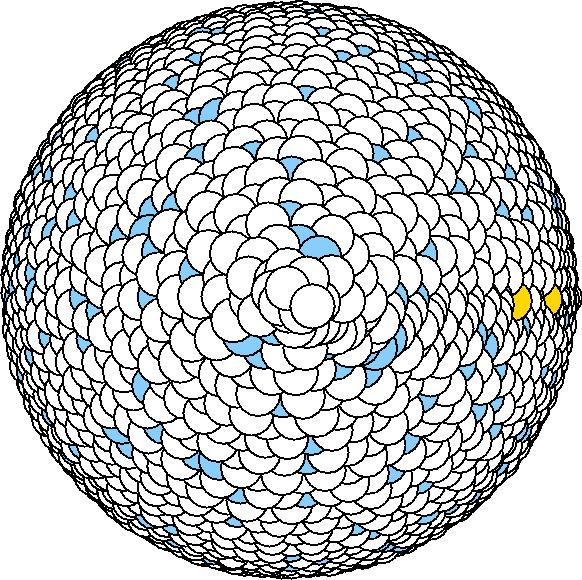
We should average the instantaneous configurations to get the average shape. Averaging the positions of each surface atom, however, is not satisfactory because the atoms diffuse at high temperatures. So we have to find out a method independent to the individual atoms. One way to do it is to divide the spherical space into solid angle cells and average the positions of the surface atoms inside each cell to get one bead for this cell. We divided theta evenly and phi with the weight of Sin(theta). The colored average shapes can be downloaded here.
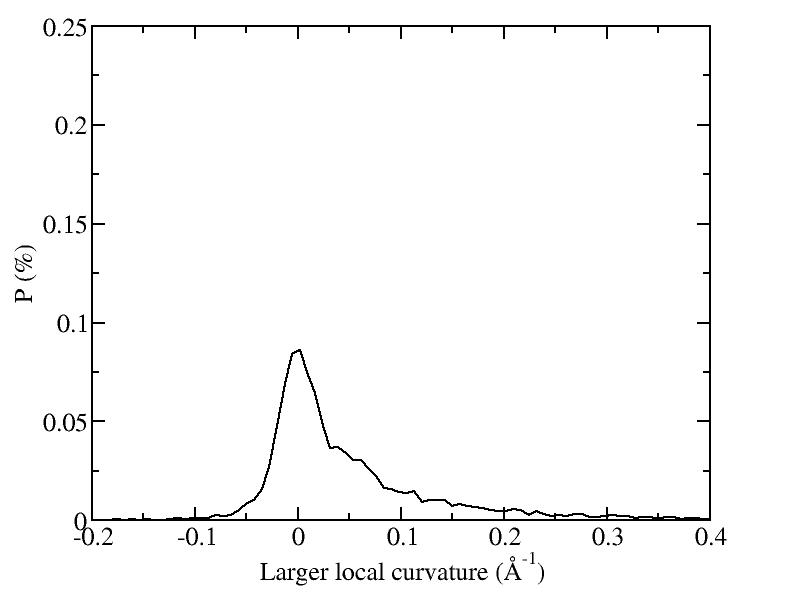
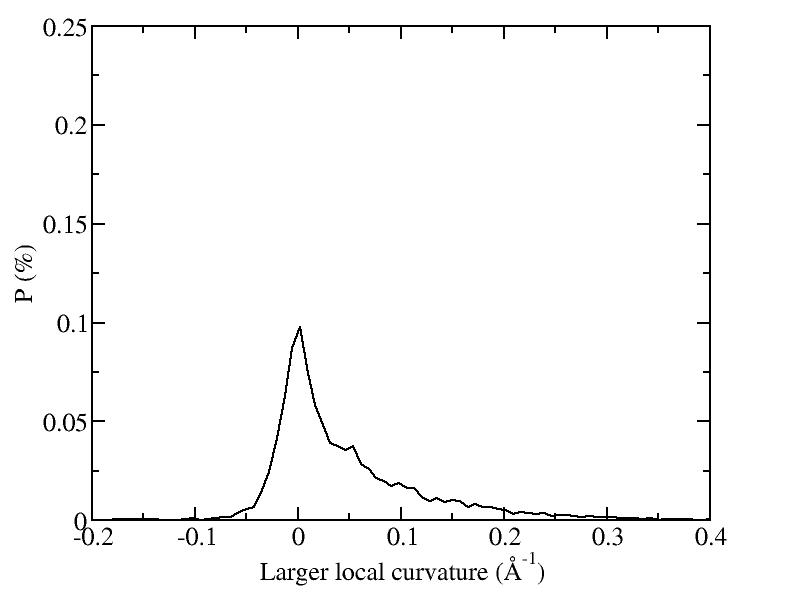
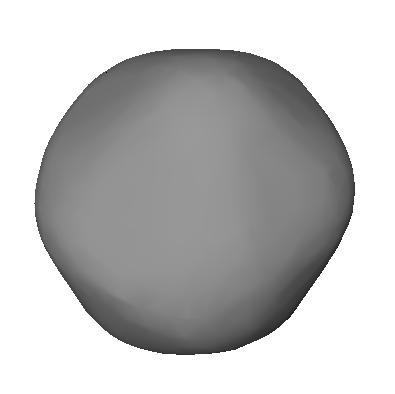
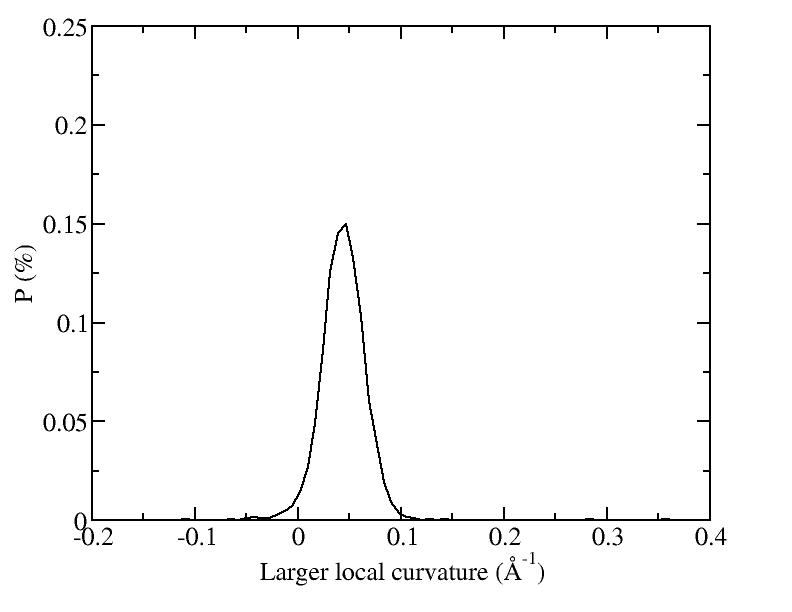
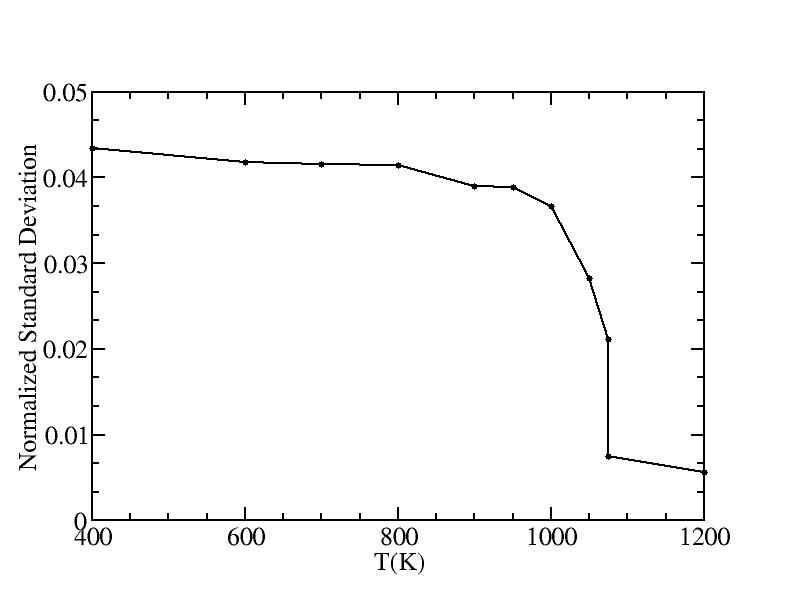
After we got the average shape, we wanted to quantify "how round" the average shape is. For each average shape, we found the optimized sphere (rc, R) for it:
R= sqrt( sumi(ri - rc)^2 / N ),
where rc is the center of mass, R is the radius.
Then we calculated the standard deviation of the distance from the beads to the optimized sphere:
Sd = sqrt( sumi (|ri - rc| - R )^2 / N ) and let it to be the measurement of the "rounding" of the average shapes.
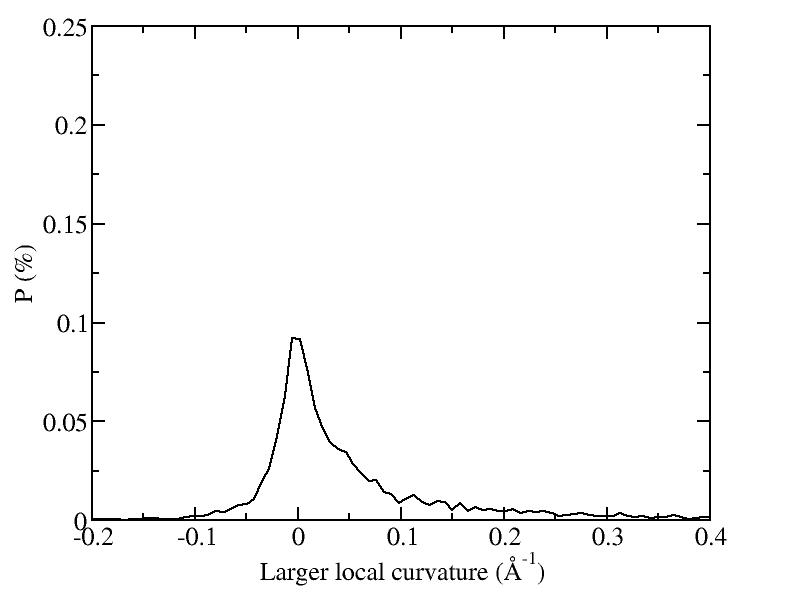
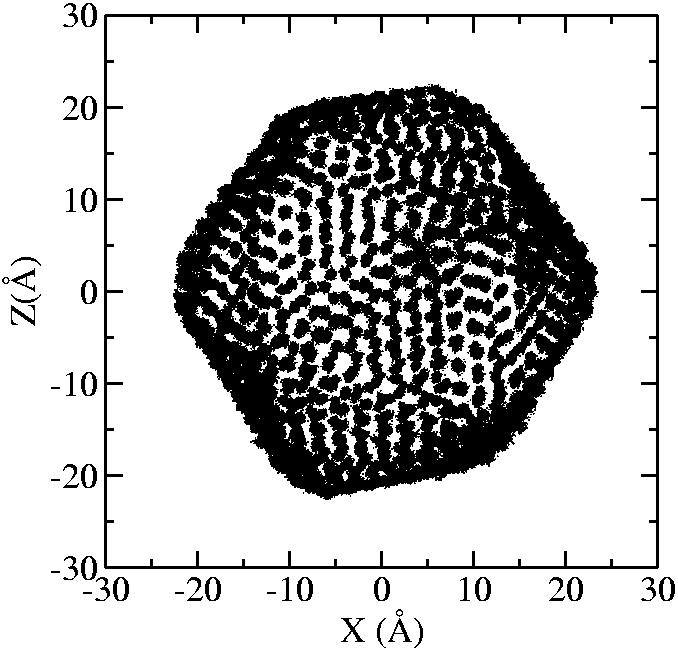
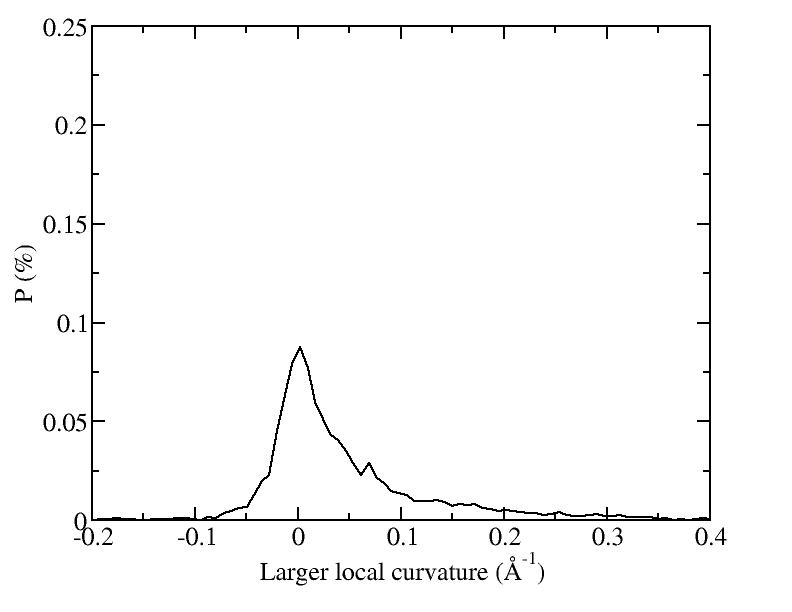
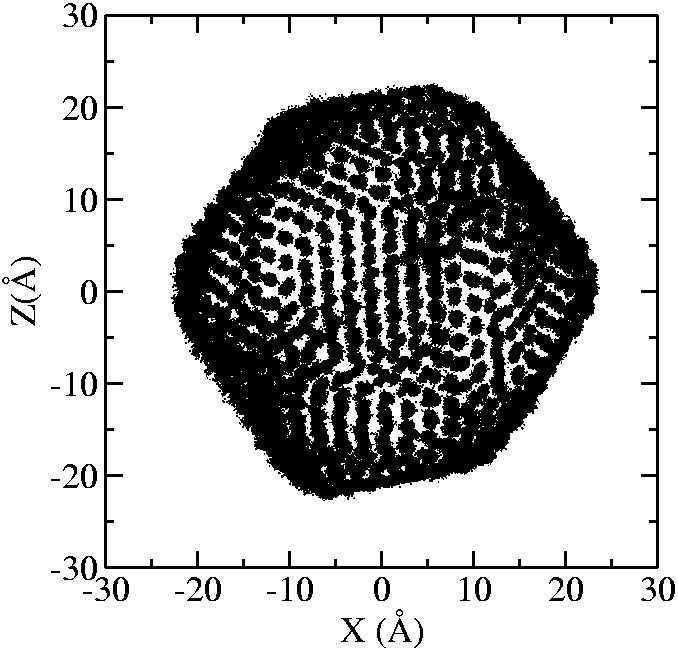
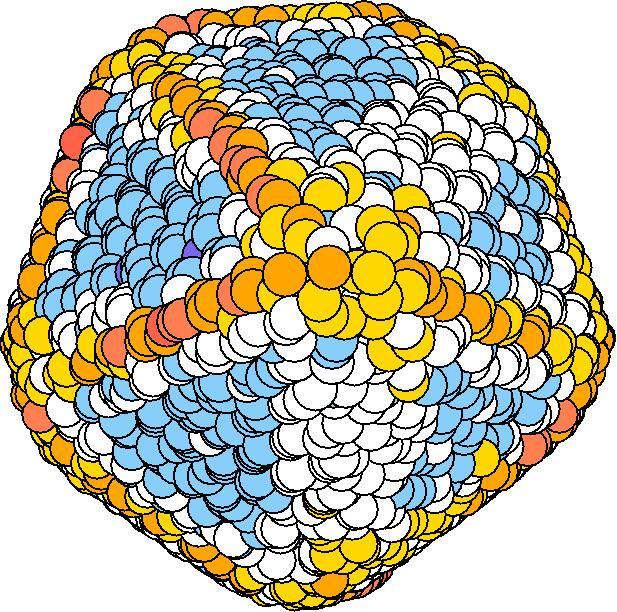
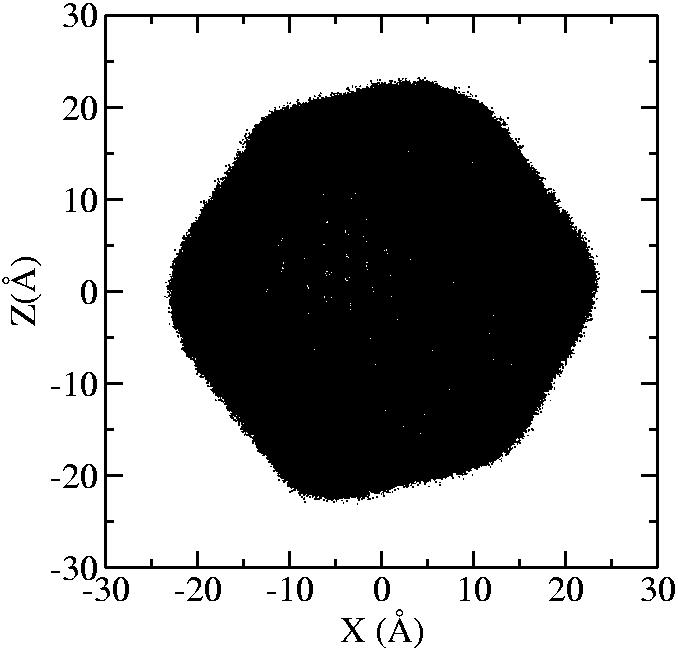
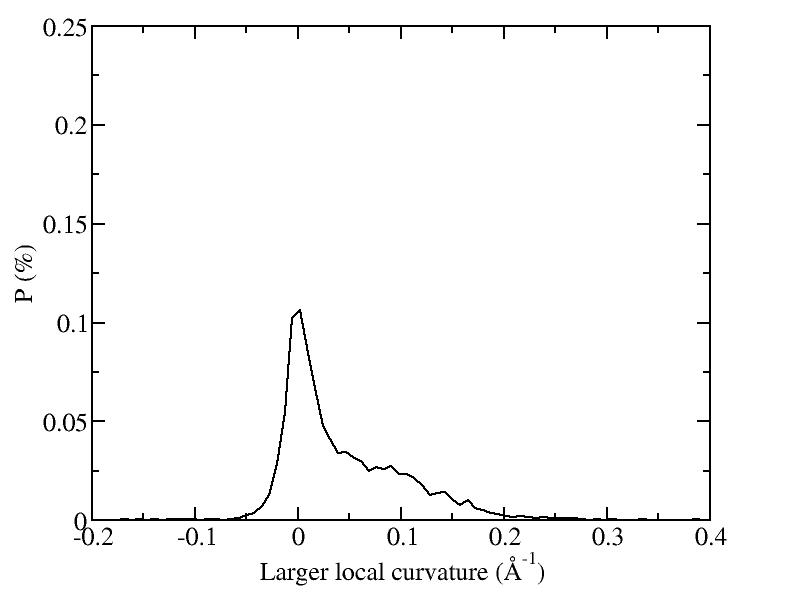
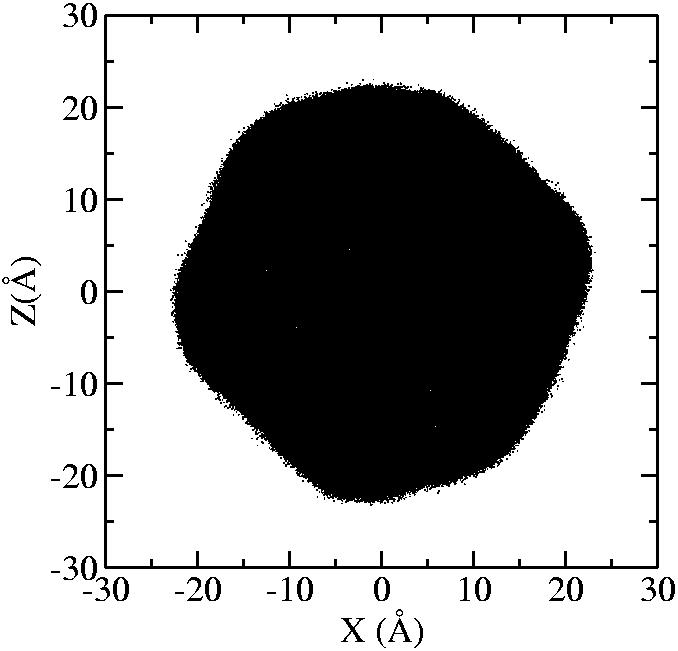
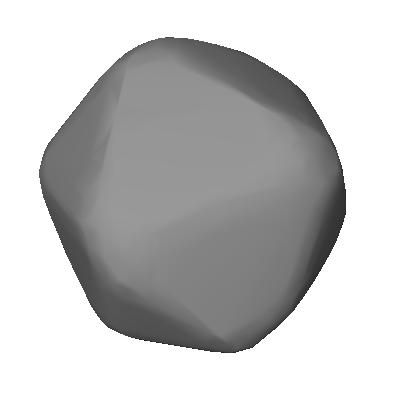
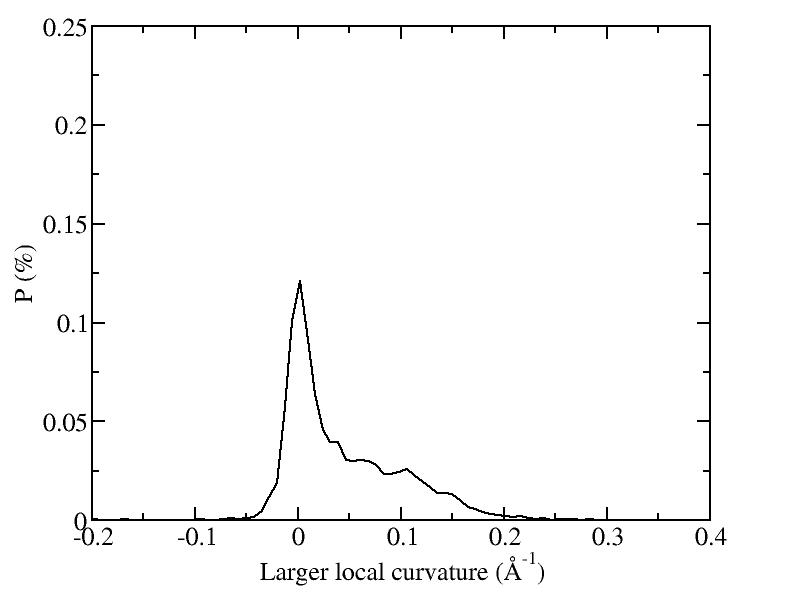
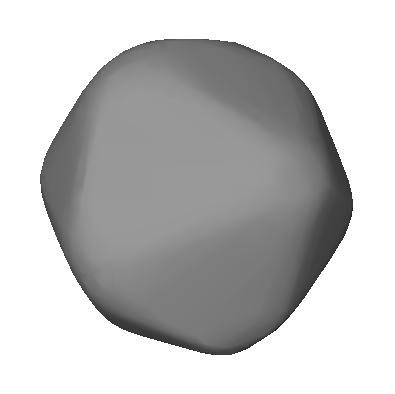
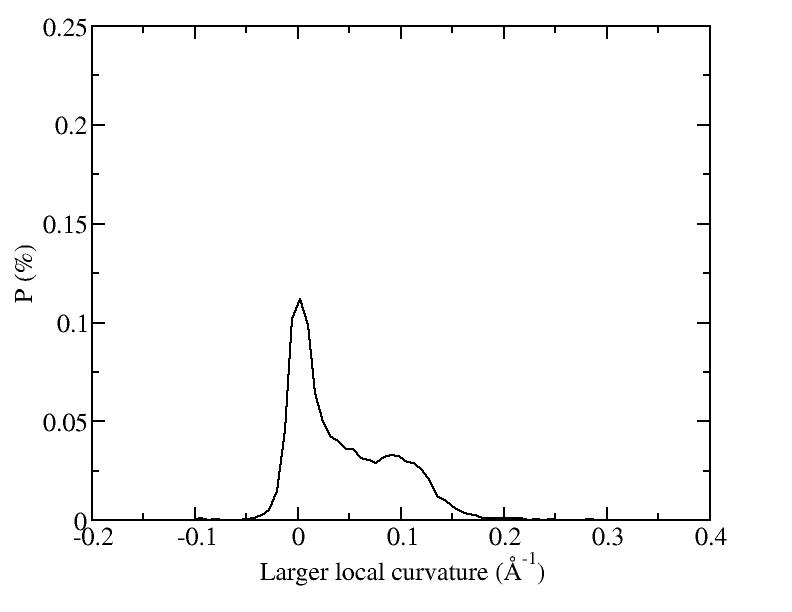
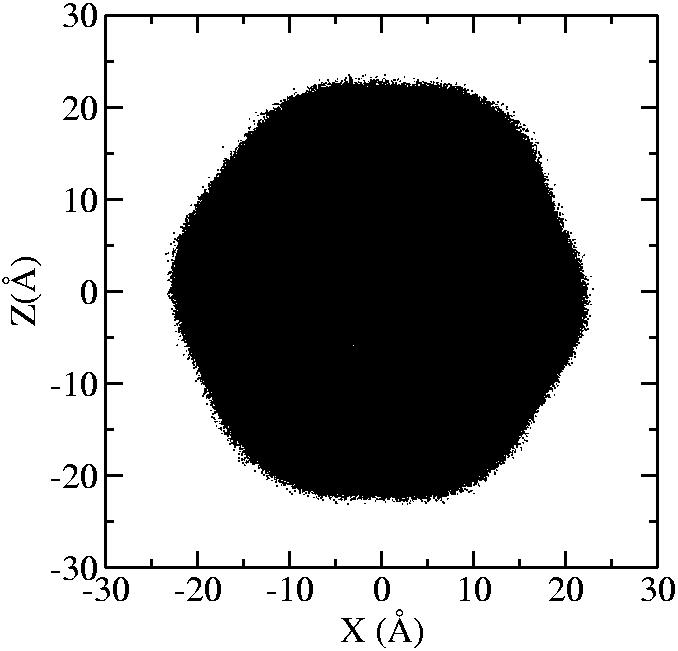
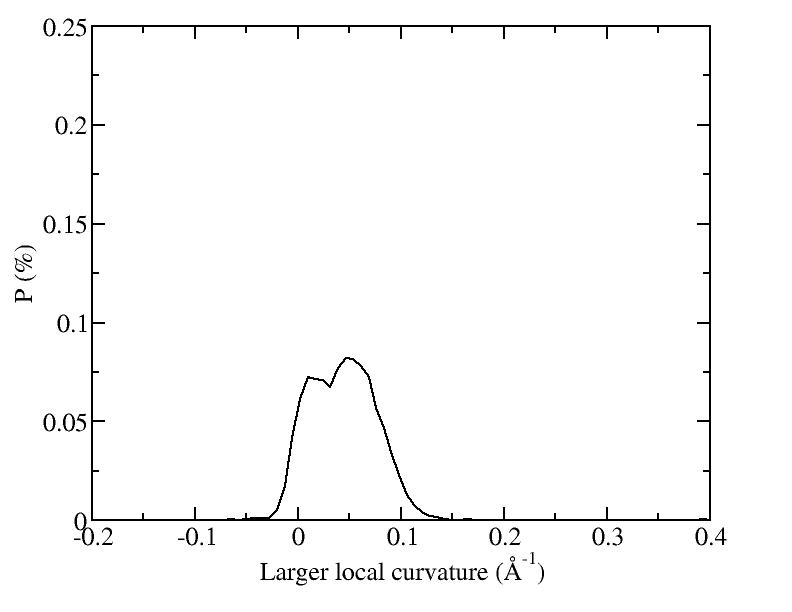
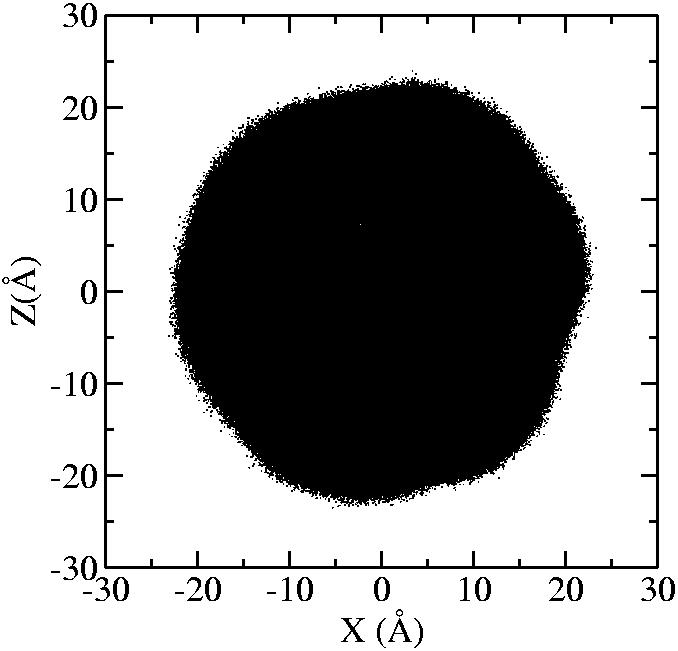
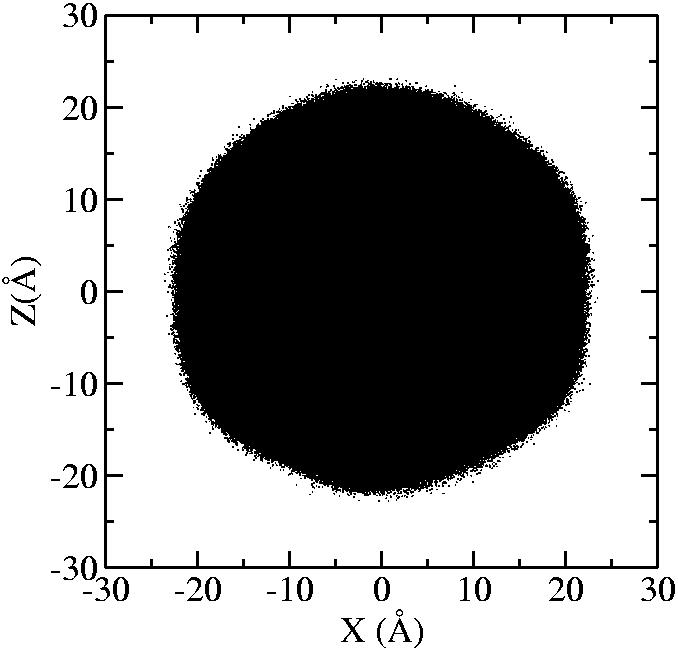
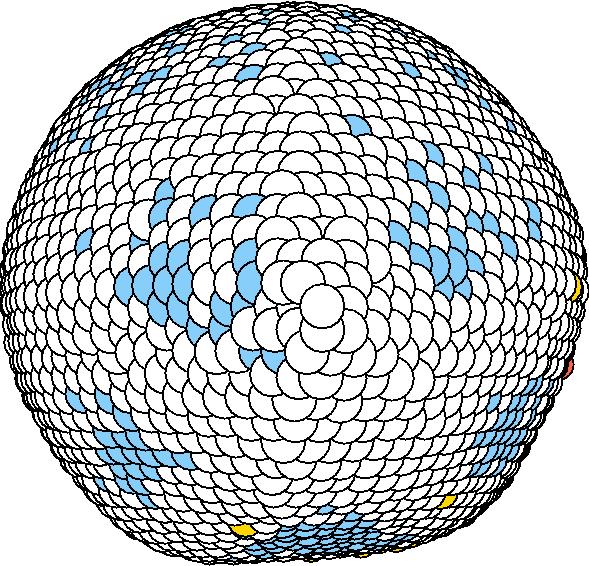
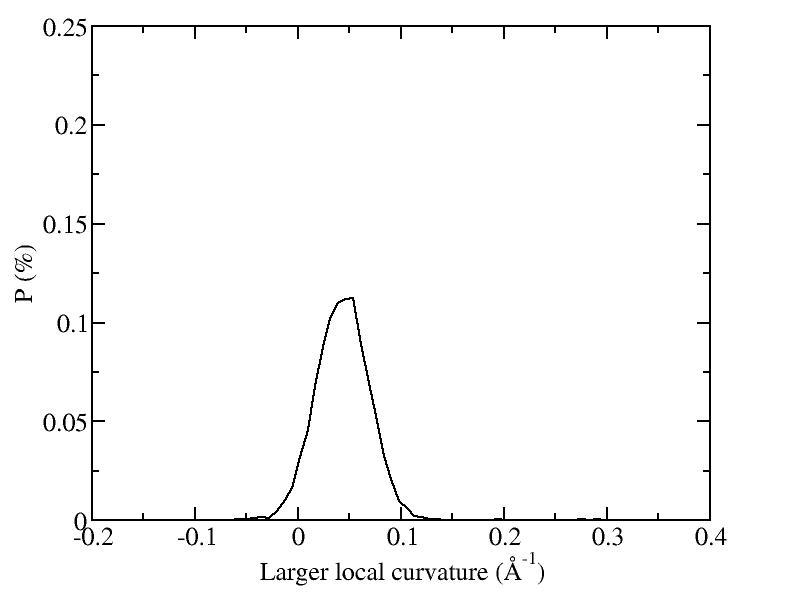
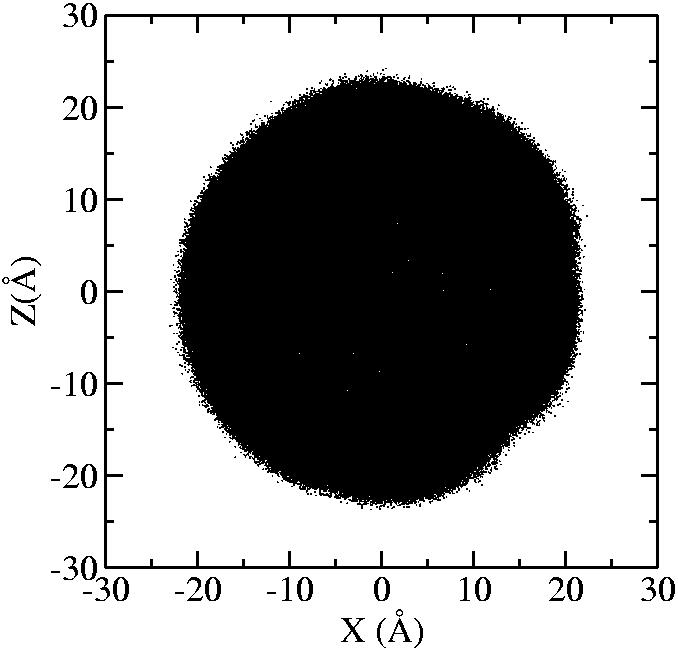
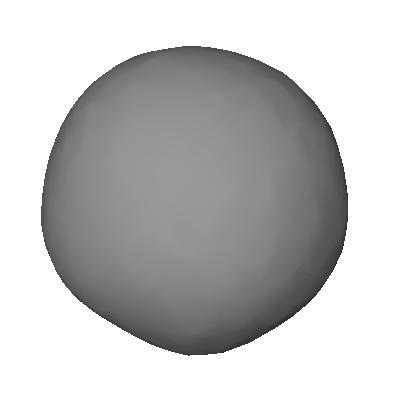
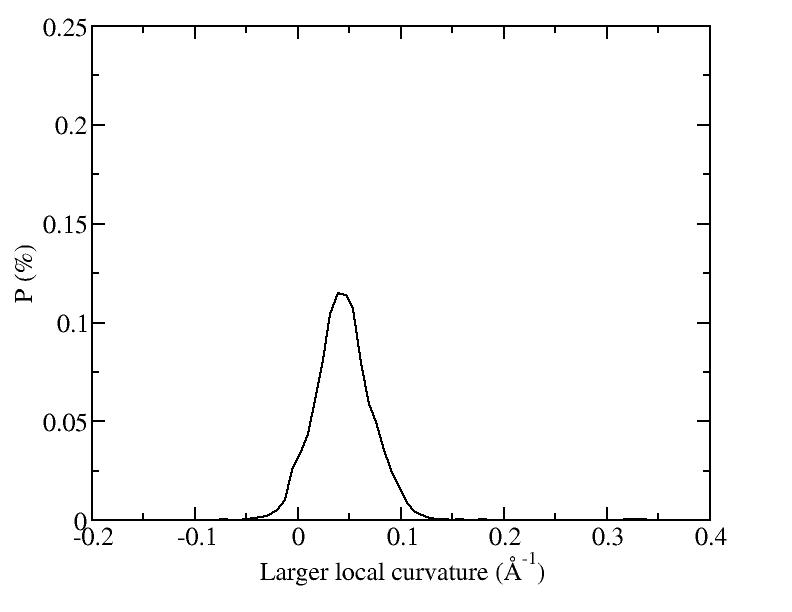
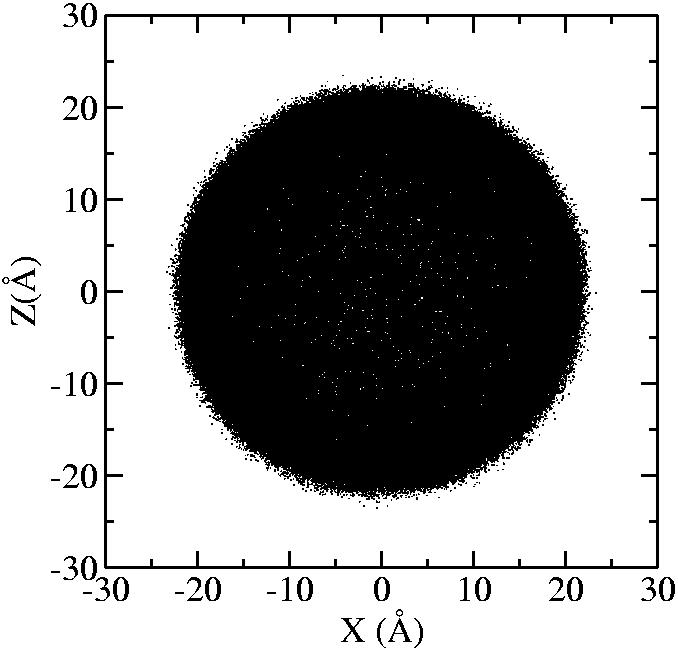
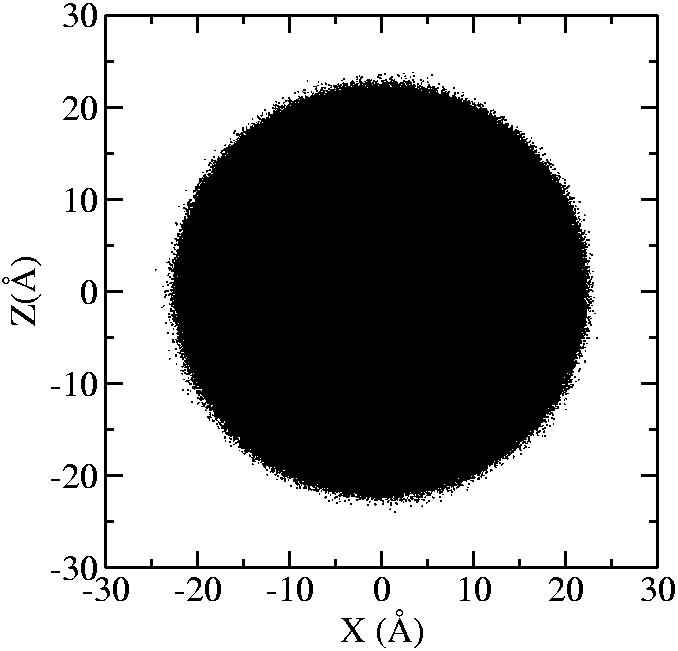
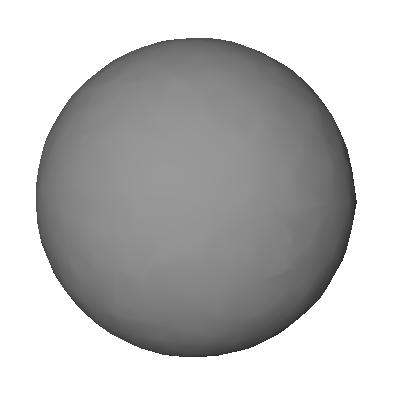
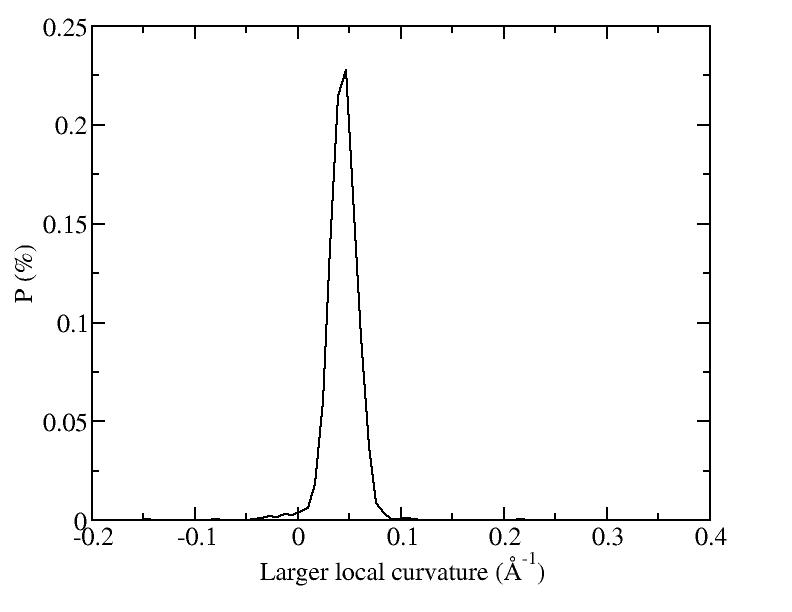
| T | 2D projection | 3D average shape | Contour plot | Larger local curvature distribution |
| 400K | |
|
|
|
| 600K | |
|
|
|
| 700K | |
|
|
|
| 800K | |
|
|
|
| 900K | |
|
|
|
| 950K | |
|
|
|
| 1000K | |
|
|
|
| 1050K | |
|
|
|
| 1060K | |
|
|
|
| 1070K | |
|
|
|
| 1075K solid | |
|
|
|
| 1075K liquid | |
|
|
|
| 1200K | |
|
|
|