Rod side shape change
Please see June 25 2003 post. The shape change may sensitively depend on the initial and procedural parameters.Slow cooling down of gold cluster
The cluster is still liquid at T=1072K. It's still running.Average shape at T=1060K and 1070K
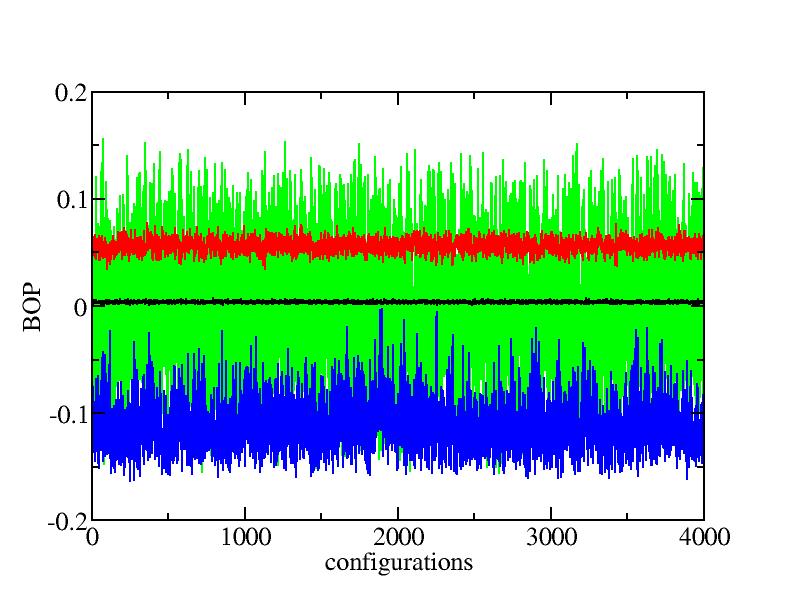
Another 1000 configurations have been collected for T=1060K and T=1070K seperately. They are both still solids. It seems that at T=1070K we still haven't run long enough to get the spherical shape which seems should be.The structure of the cluster kept unchanged during the long-run simulation. The following plot is the BOP for 1070K with 4000 configurations:
The standard deviations vs configurations:
| T | First 500 | Second 500 | First 1000 | Second 1000 | First 2000 | Second 2000 | First 4000 |
| 1060K | 0.026416 | 0.0251141 | 0.0218043 | 0.023679 | 0.0202576 | 0.0187608 | 0.0170964 |
| 1070K | 0.0230212 | 0.0208985 | 0.0194291 | 0.0179193 | 0.0149465 | 0.0122996 | 0.0102416 |
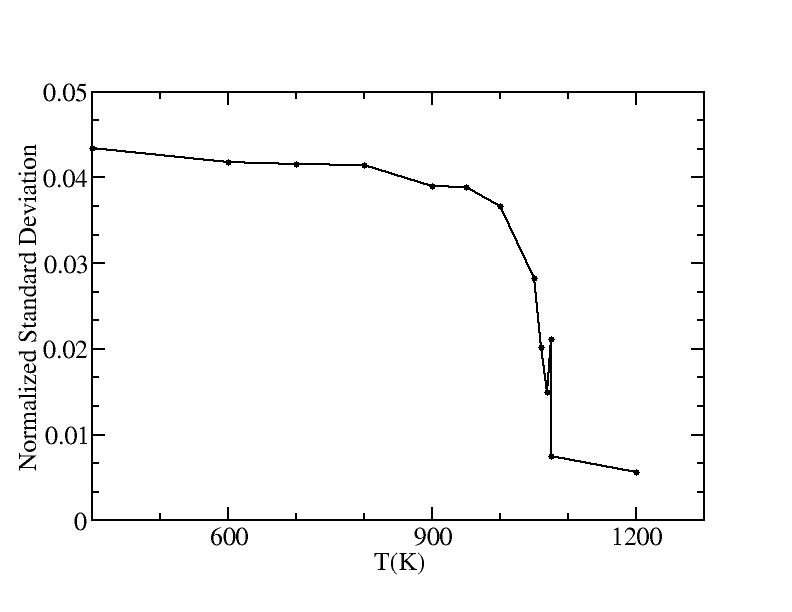
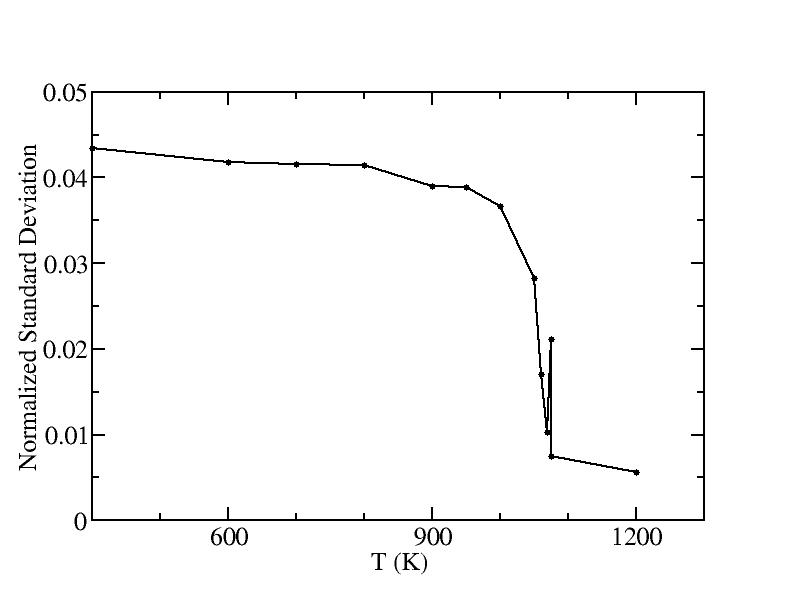
The plots of standard deviation vs temperature with 2000 and 4000 configurations for 1060K and 1070K:
 |
 |
Contour pictures of cluster average shape
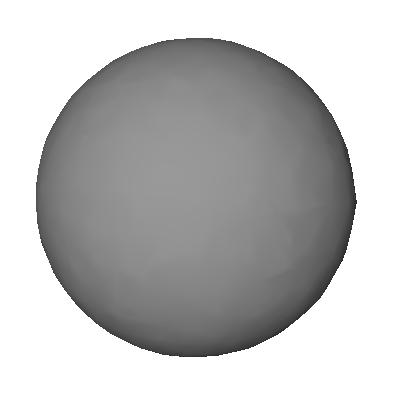
The pictures can be generated by VMD with the script 3d_delaunay_surface.tcl. Here just show the two picture of T=400K and T=1200K.400K
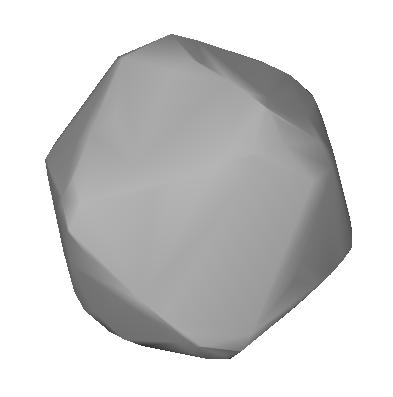
1200K