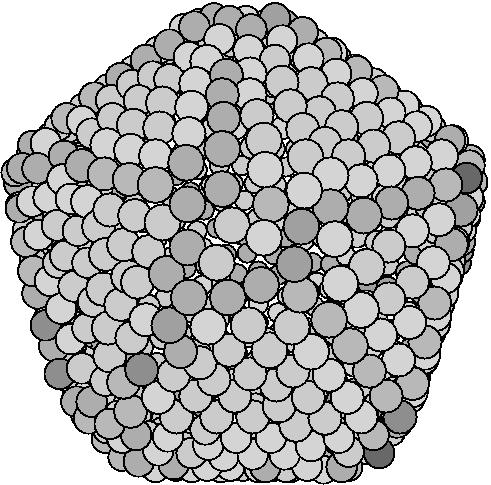
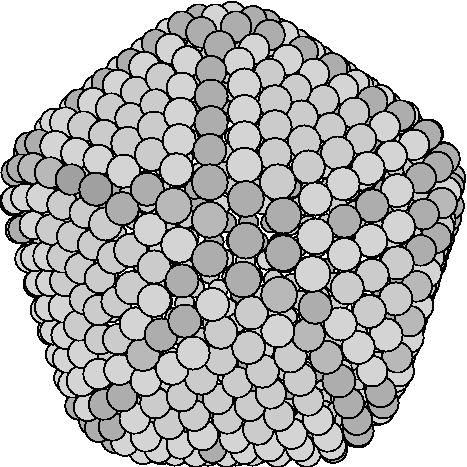
Animation of instantaneous configurations at T=1070K
Long run
They are 10 instantaneous configurations sampling evenly from the equilibrium run of 430ps.
Short run
Totally 100 configurations have been saved from an equilibrium run of 430ps. Every 4 configurations have been averaged to get 97 averaged configurations. The first 20 of them are shown here.
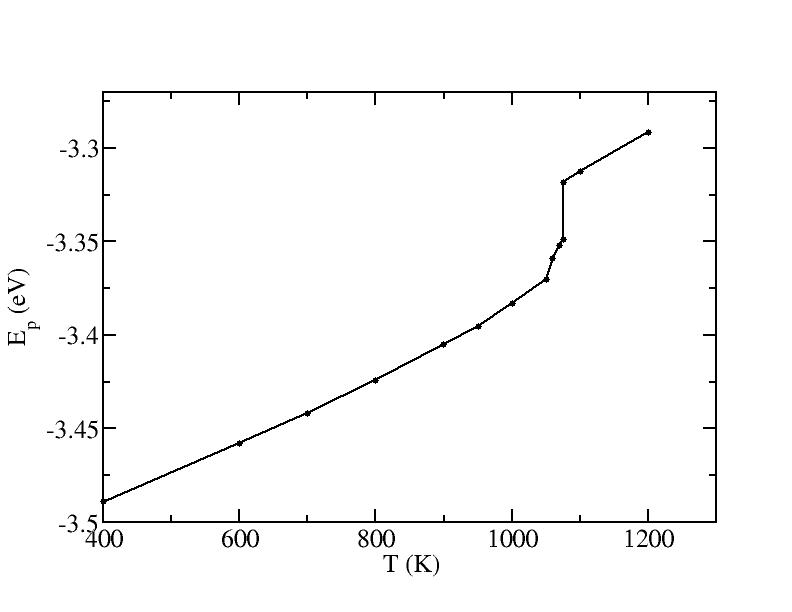
Caloric curve of potential energy
File: ep.datAt each temperature 10000 points have been sampled from 10^7 steps (43ns) running. The potential energies are the average values of these 10000 points except for T=1075K, for which first 6000 points are solid and the rest 4000 points are liquid, and they have been averaged seperately to get two points.
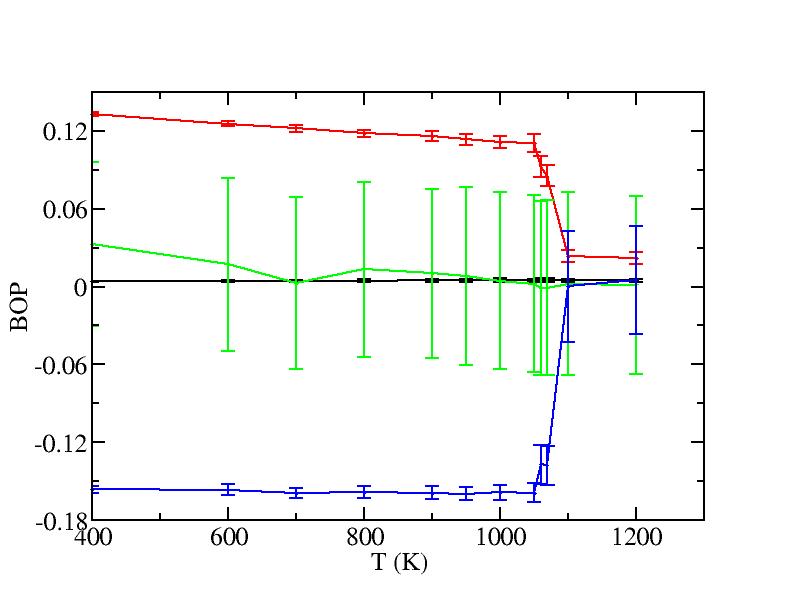
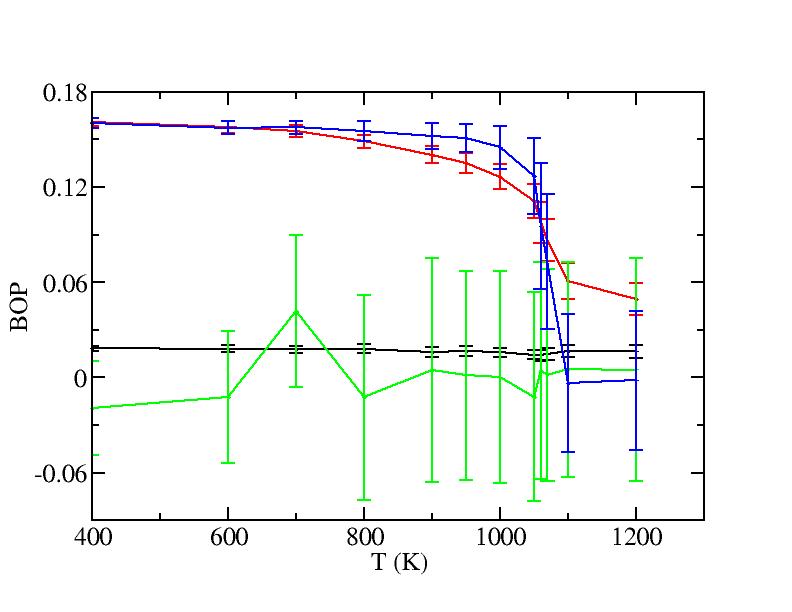
Bond order parameters with error bars
Files:- body.1.bop -- Interior Q4
- body.2.bop -- Interior Q6
- body.3.bop -- Interior W4
- body.4.bop -- Interior W6
- surf.1.bop -- Surface Q4
- surf.2.bop -- Surface Q6
- surf.3.bop -- Surface W4
- surf.4.bop -- Surface W6
Plots:
Inerior:
Surface:
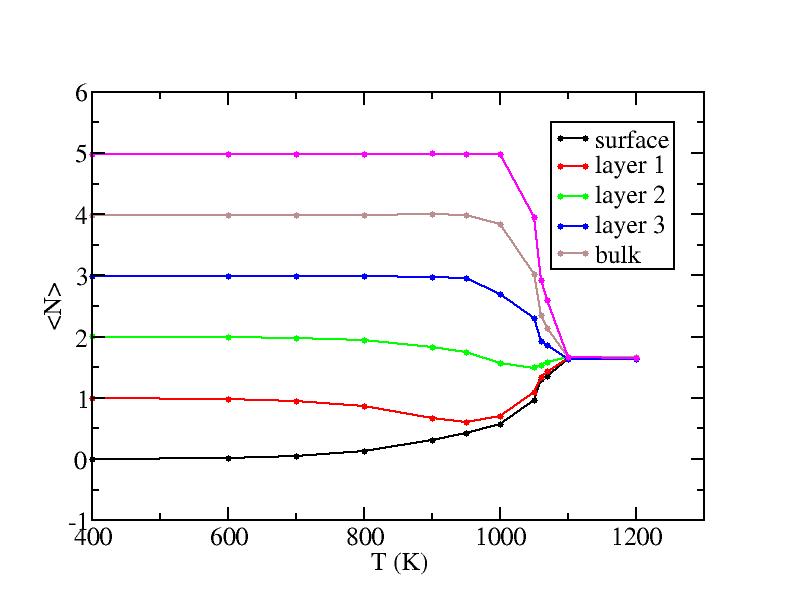
Interlayer diffusion
File: trace.datPlot:
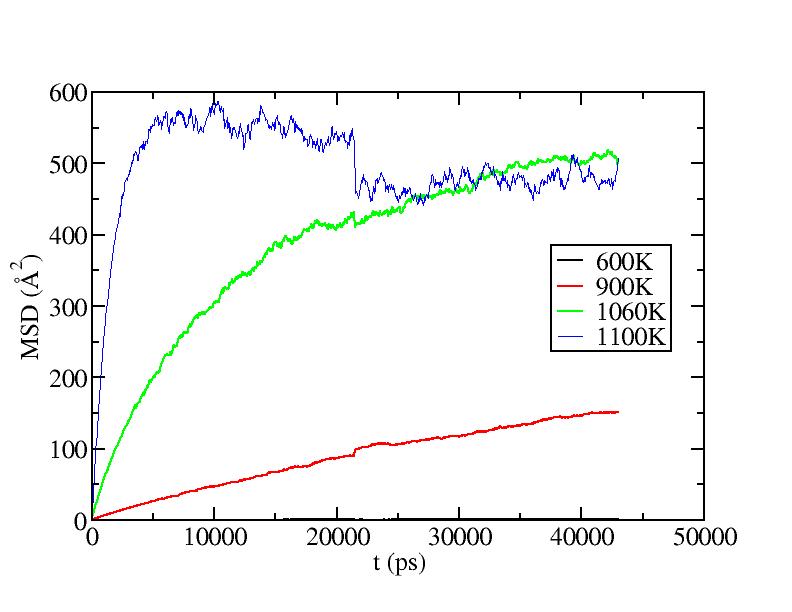
Mean squared displacements of surface atoms
File: msd.datPlot:
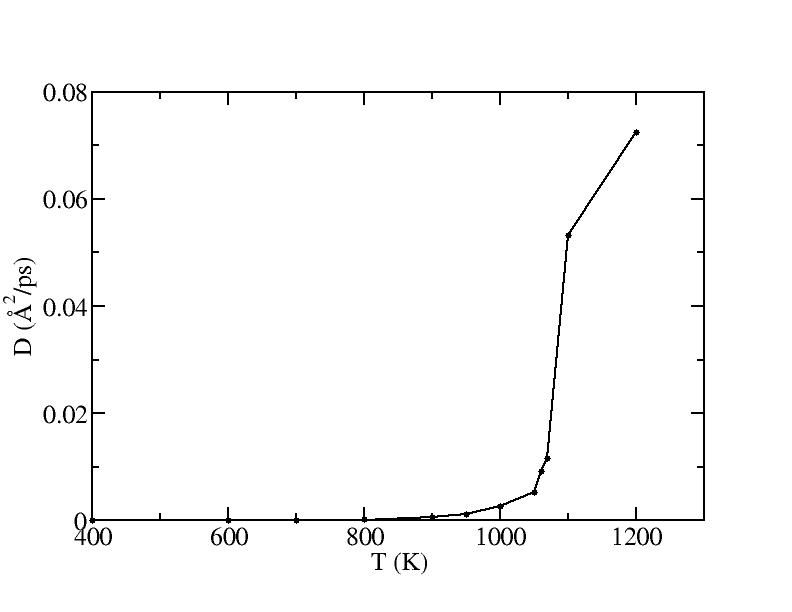
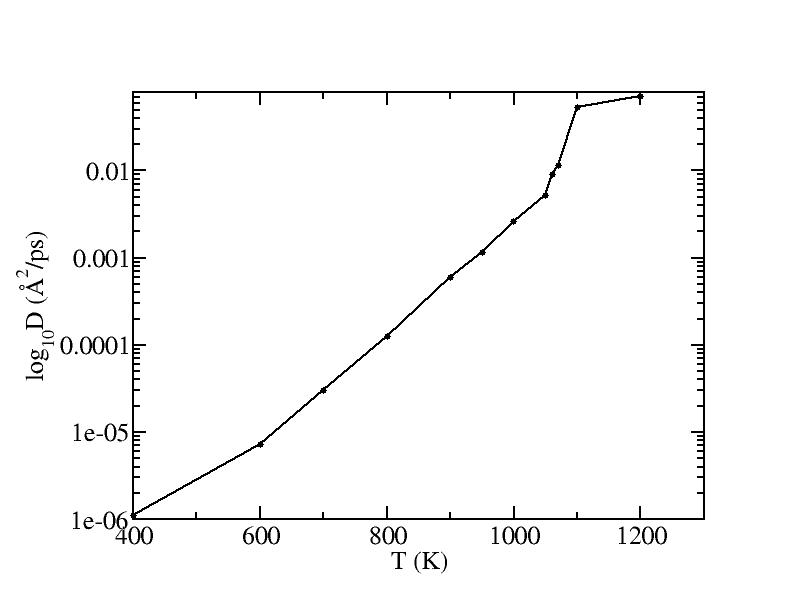
Diffusion coefficient
File: surf.diffPlots:
Linear axis:
Logrithmic Y axis:
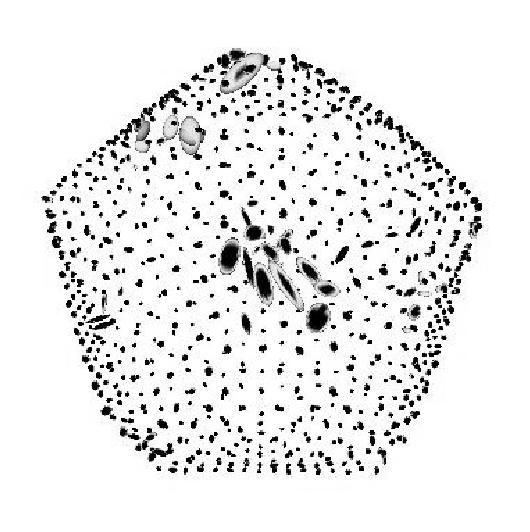
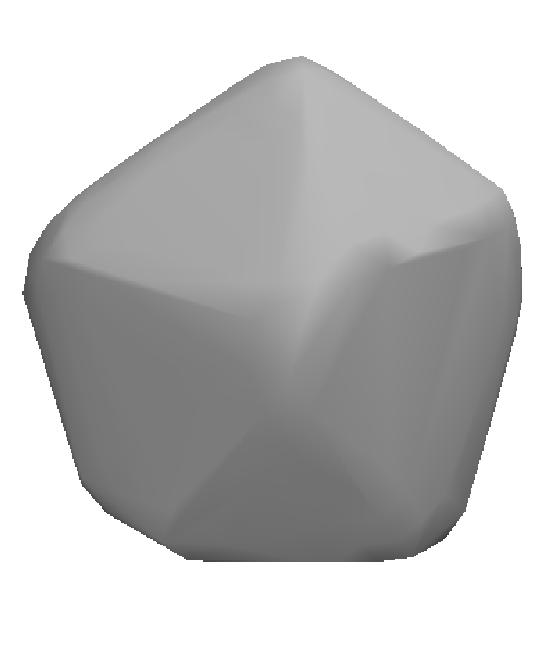
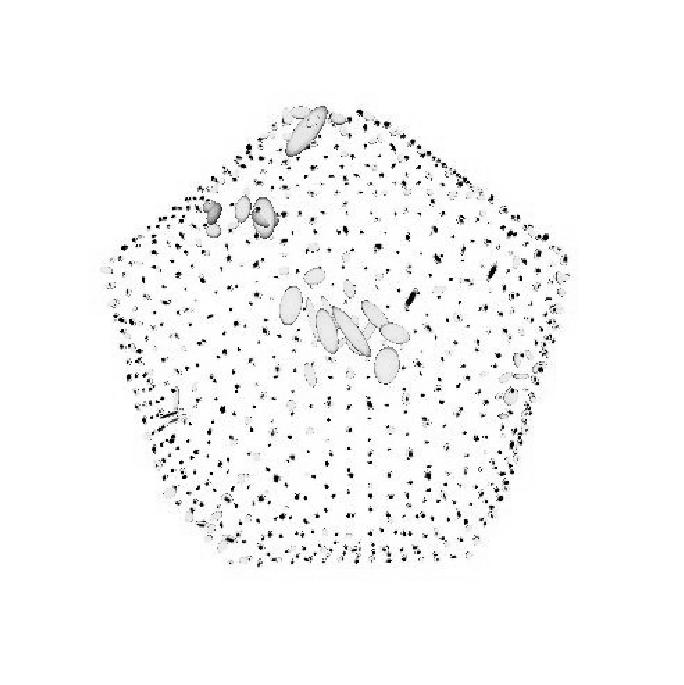
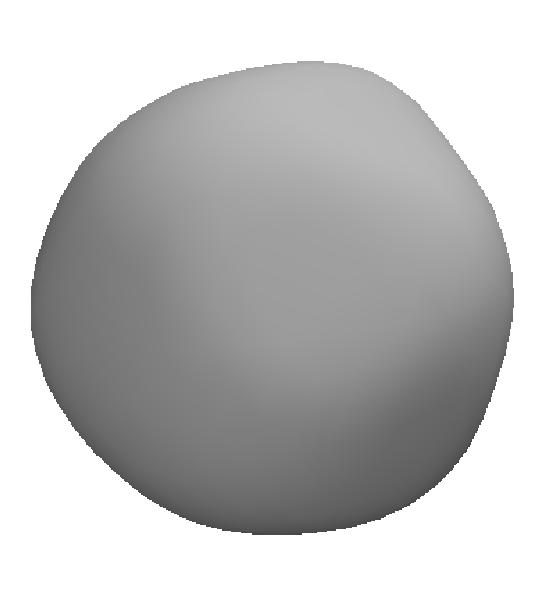
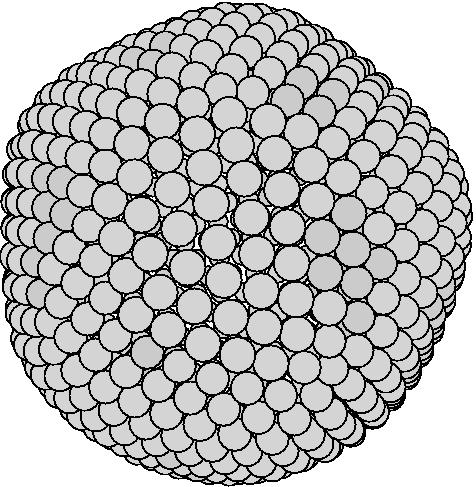
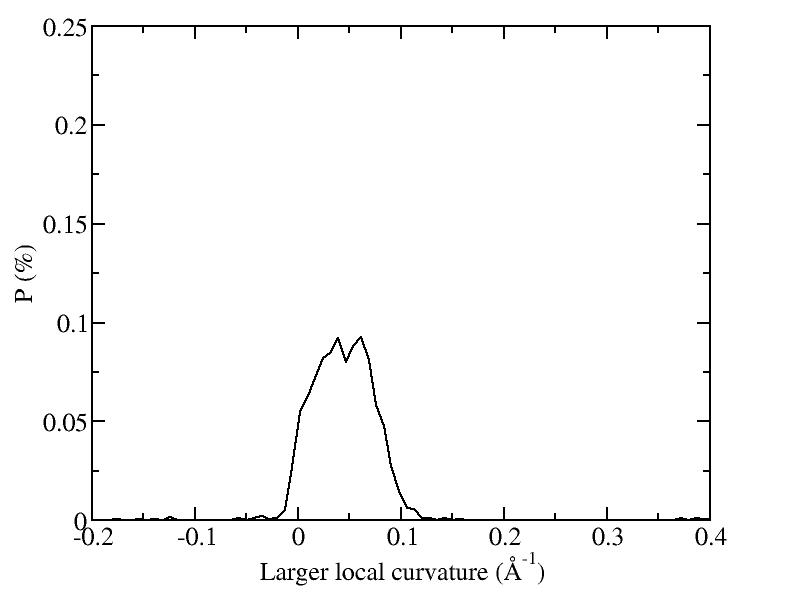
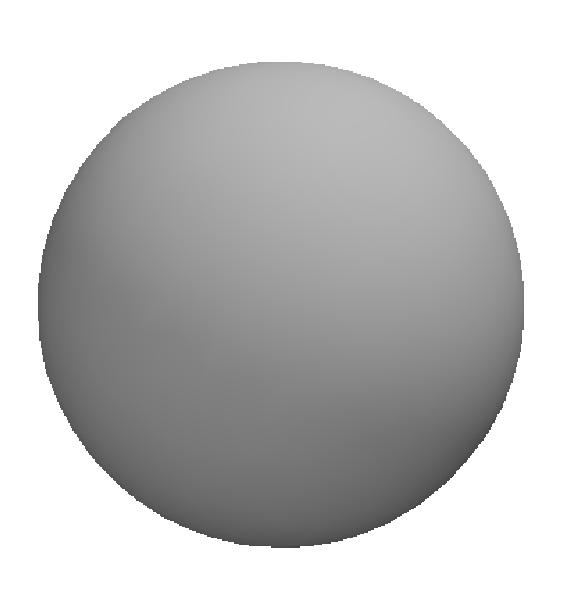
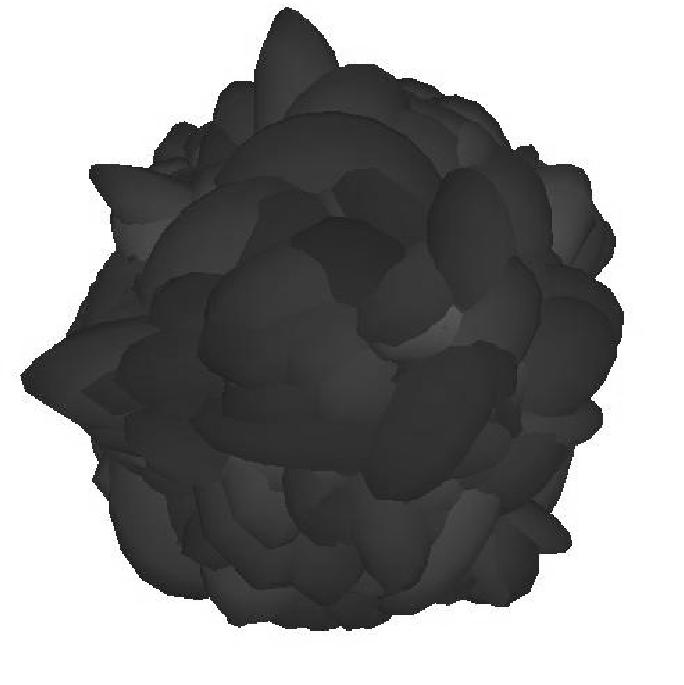
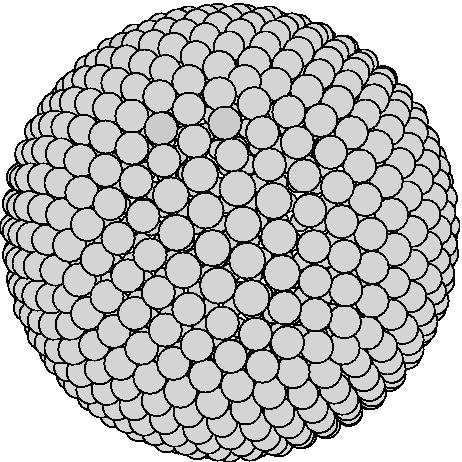
Average shapes of 600K, 900K, 1060K and 1100K
Files:
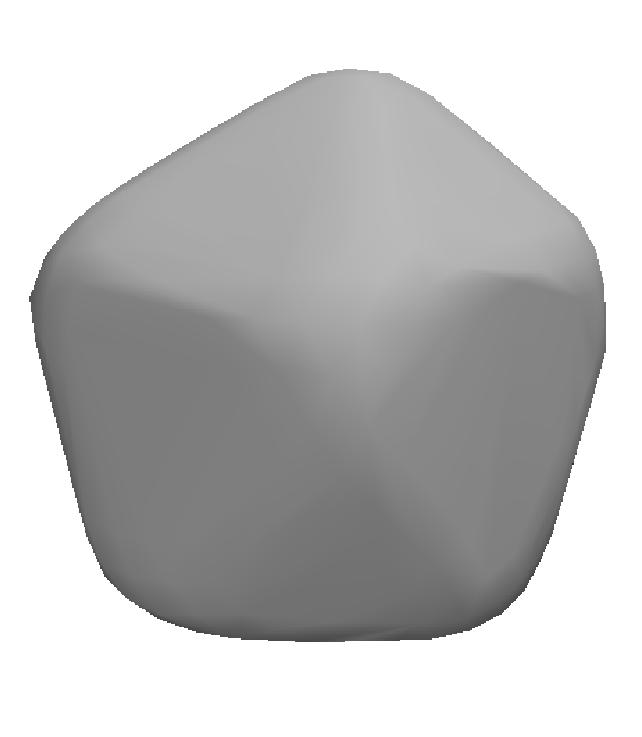
- 600K.cntr.eps
-- Shaded surface image of average shape
- 900K.cntr.eps
-- Shaded surface image of average shape
- 1060K.cntr.eps
-- Shaded surface image of average shape
- 1100K.cntr.eps
-- Shaded surface image of average shape
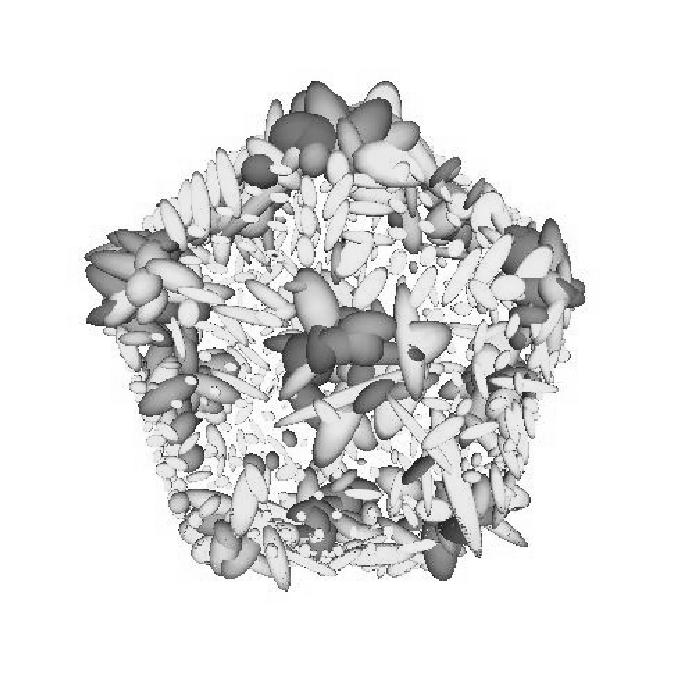
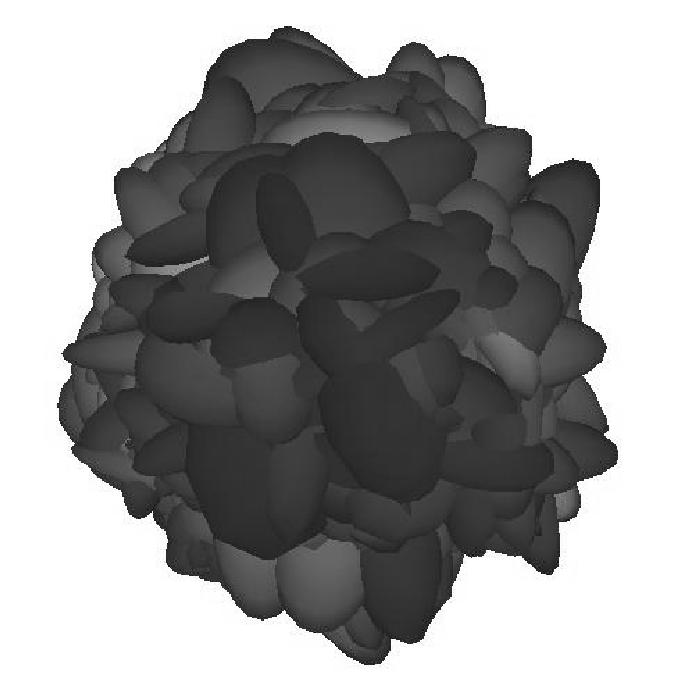
- 600K.ellipse.eps
-- Ellipsoid representation of surface atom movements (100 confs.)
- 900K.ellipse.eps
-- Ellipsoid representation of surface atom movements (100 confs.)
- 1060K.ellipse.eps
-- Ellipsoid representation of surface atom movements (100 confs.)
- 1100K.ellipse.eps
-- Ellipsoid representation of surface atom movements (100 confs.)
- 600K.color.eps
-- surface image of average shape with ih symmetric points
- 900K.color.eps
-- surface image of average shape with ih symmetric points
- 1060K.color.eps
-- surface image of average shape with ih symmetric points
- 1100K.color.eps
-- surface image of average shape with ih symmetric points
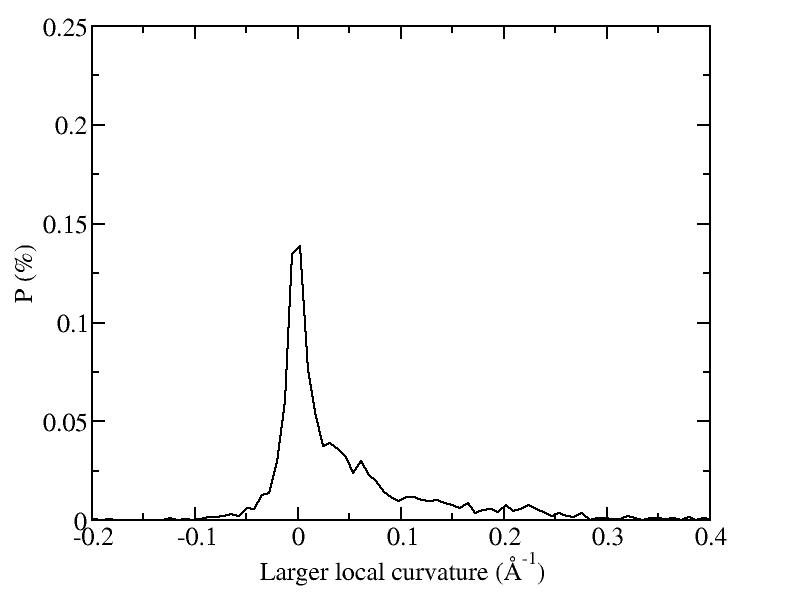
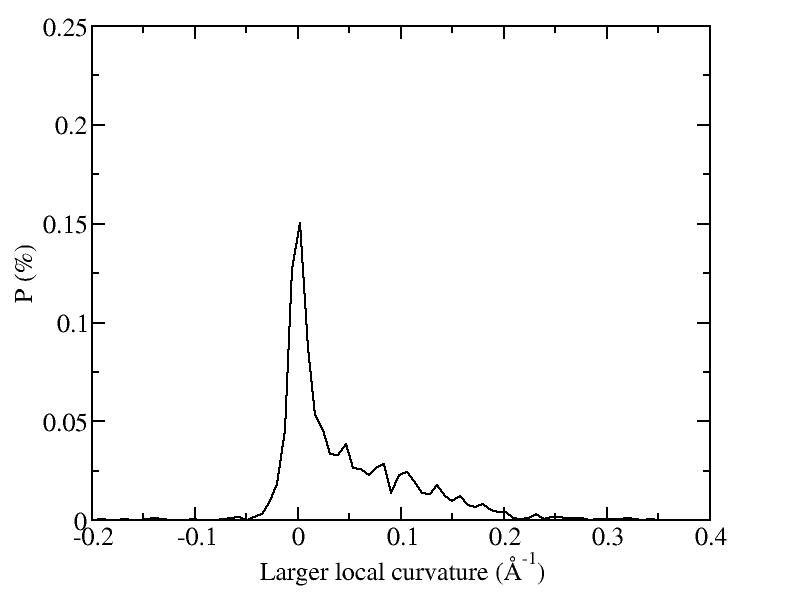
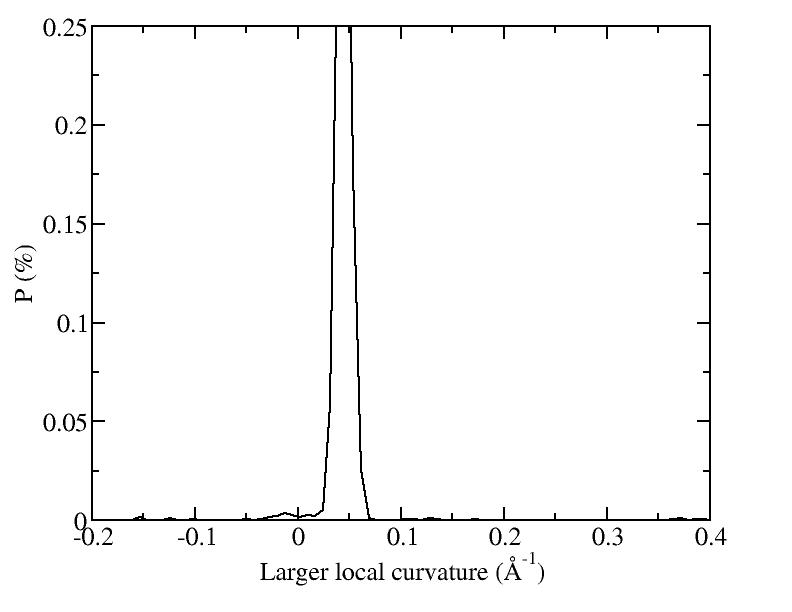
- 600K.hist.dat
-- The histogram of the average local curvatures given by
ih-point plots
- 900K.hist.dat
-- The histogram of the average local curvatures given by
ih-point plots
- 1060K.hist.dat
-- The histogram of the average local curvatures given by
ih-point plots
- 1100K.hist.dat
-- The histogram of the average local curvatures given by
ih-point plots
T(K)
Shaded
Ellipsoid
Ih Points
Histrogram
600
900
1060
1100
| T(K) | Shaded | Ellipsoid | Ih Points | Histrogram |
| 600 |
|
|
|
|
| 900 |
|
|
|
|
| 1060 |
|
|
|
|
| 1100 |
|
|
|
|