November 26 2002
Results for 1409 atoms by cooling
Gold nanosphere with 1409 atoms went through Andersen thermostat MD consecutively
from 1500K down to 100K for 5*10^6 steps (21 ns) each temperature level.
The last configurations at each temperature then went through a constant
temperature MD for 10^6 steps (4.3 ns). Finally the configurations went
through a constant energy MD for 5*10^5 steps (2.1 ns) to collect data.
From the result data we can conclude:
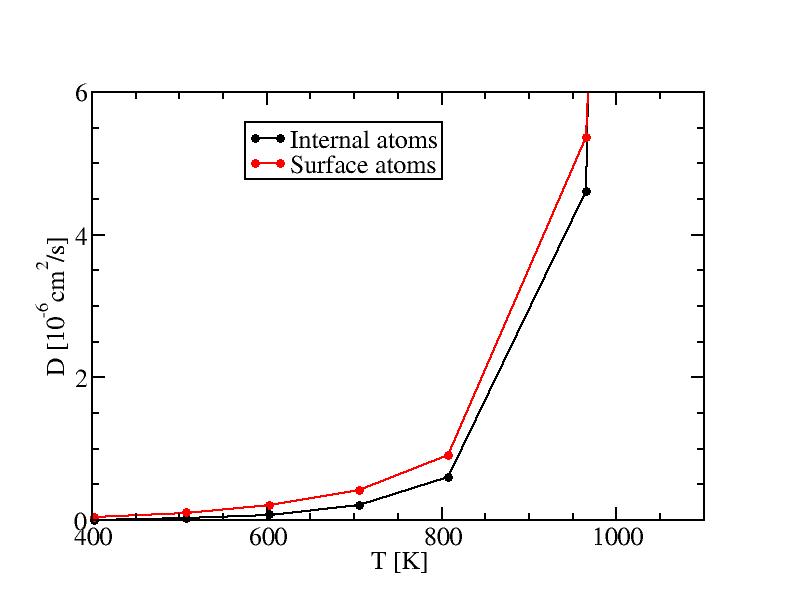
1) The overall melting temperature is between 966K and 989K.
2) The surface melting temperature is between 603K and 706K.
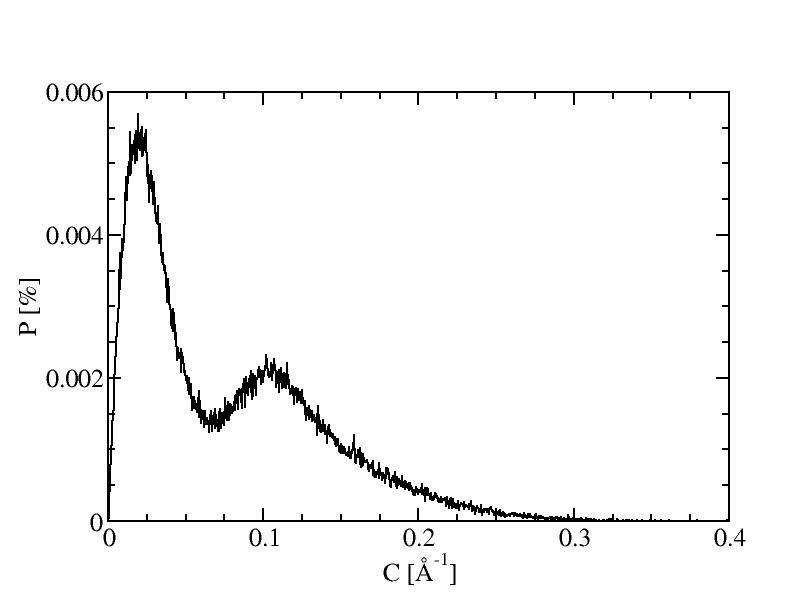
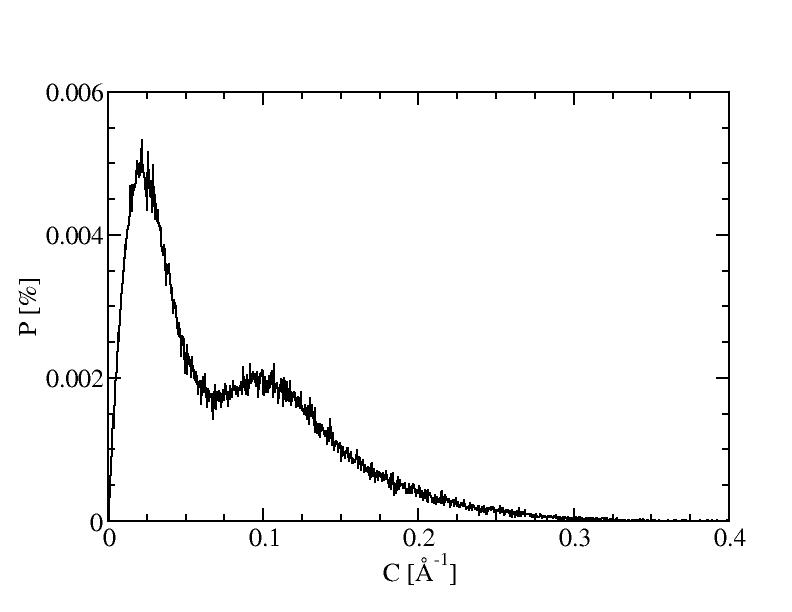
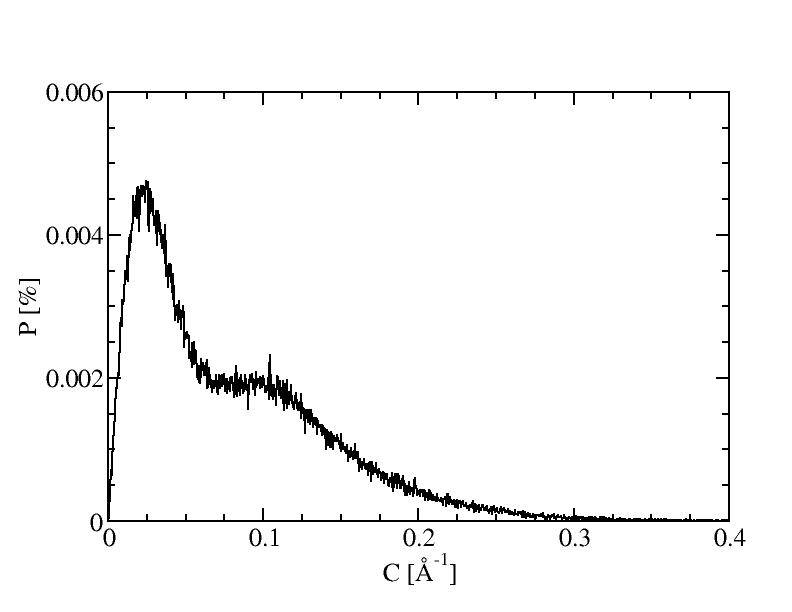
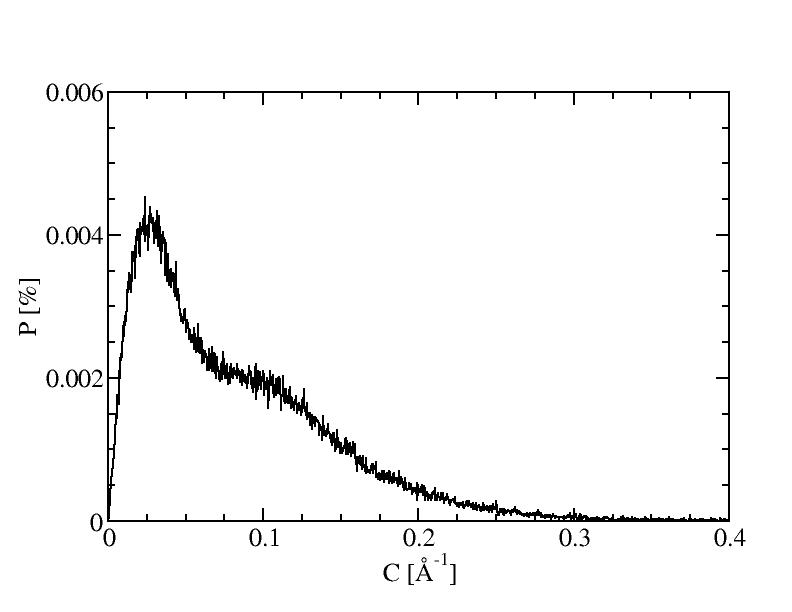
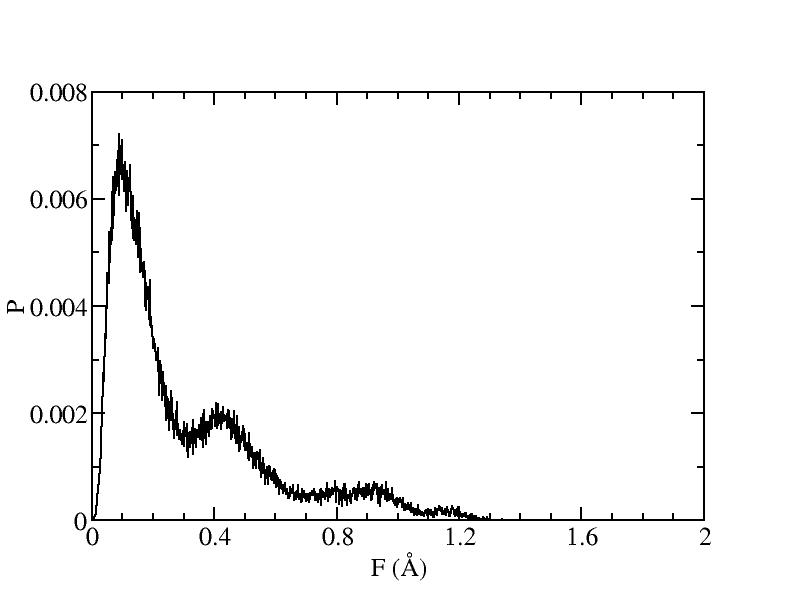
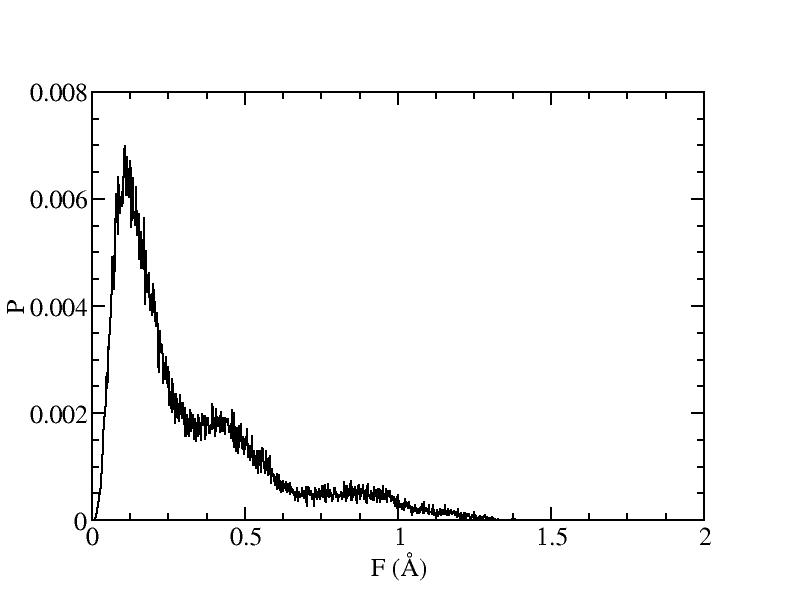
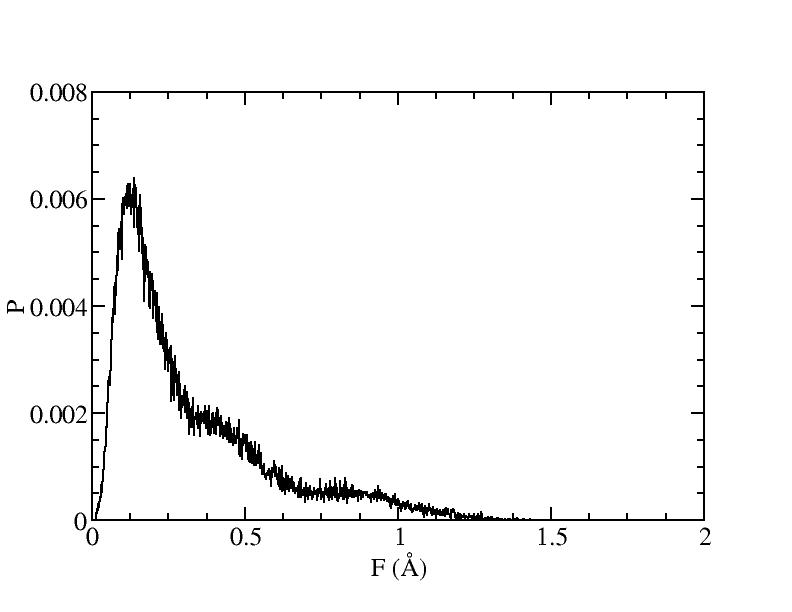
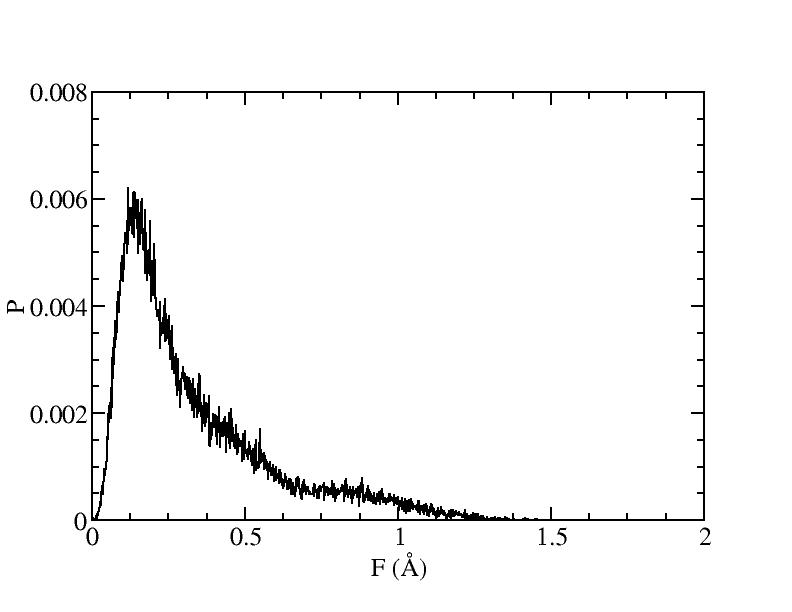
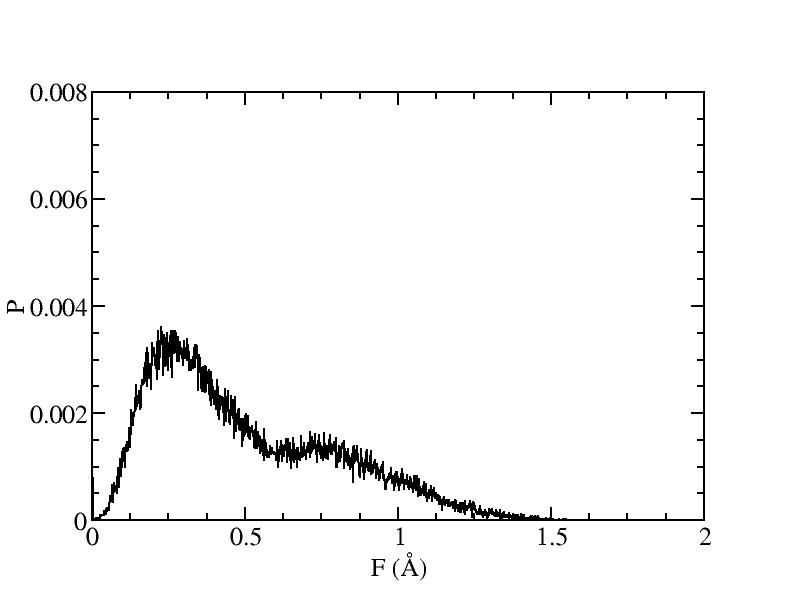
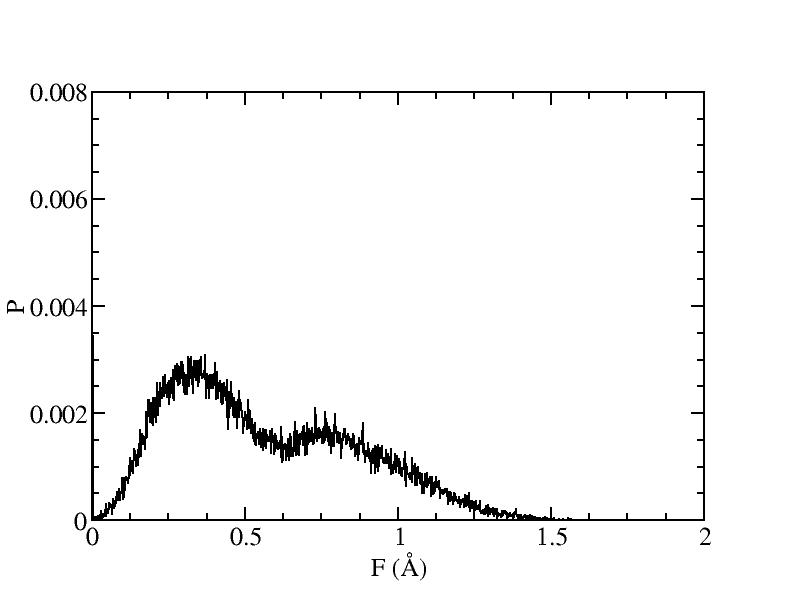
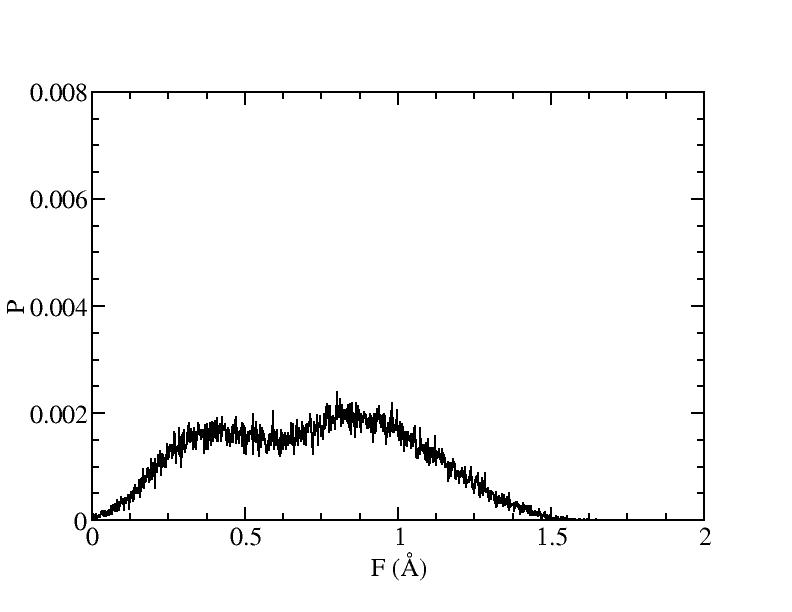
3) The facets become smaller (the left peak becomes lower) and less
flat (the two peaks come closer) with increasing temperature.
4) The facets totally disappear before the internal atoms melt (the
inernal atoms are still solid at 966K).
5) The disappearing of facets may reflect the surface melting procedure.
The relation of surface melting and faceting is still under consideration.
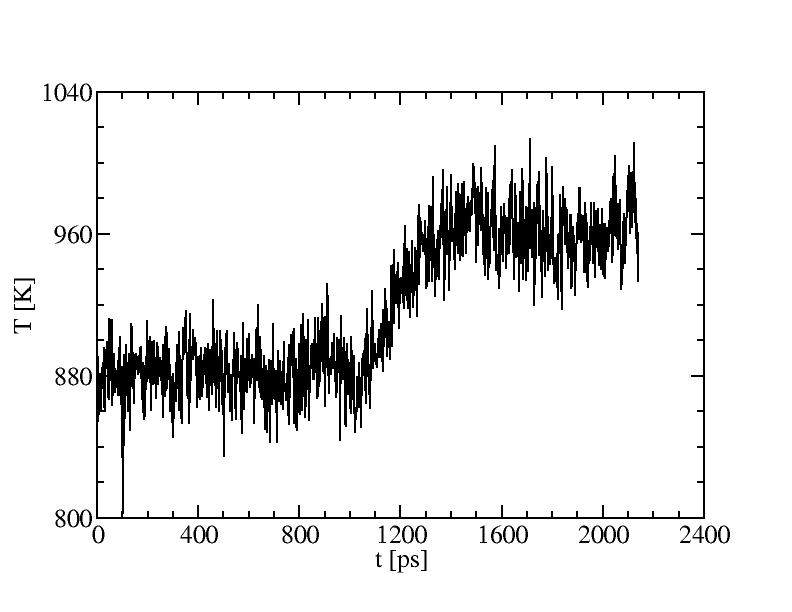
Transition at 900K
During constant energy MD, the configuration with initial temperature of
900K had an obvious structural change at about 1 ns. The temperature increased
from about K to about 960K. The structure changed from liquid-like to icosahedral-like.
This transition has not been found at other temperature levels. I think
this occured because the melting temperature for 1409 atoms with icosahedral
structure is in the range of 900K and 1000K so that the initial configuration
was near the saddle point. Additional 10^5 steps (0.43ns) constant energy
MD was processed to collect data for solid status at 960K.
Temperature
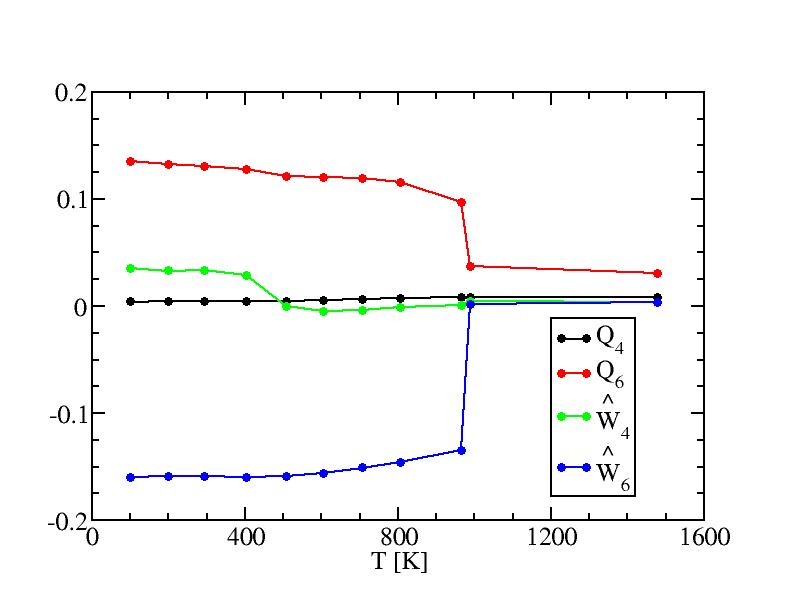
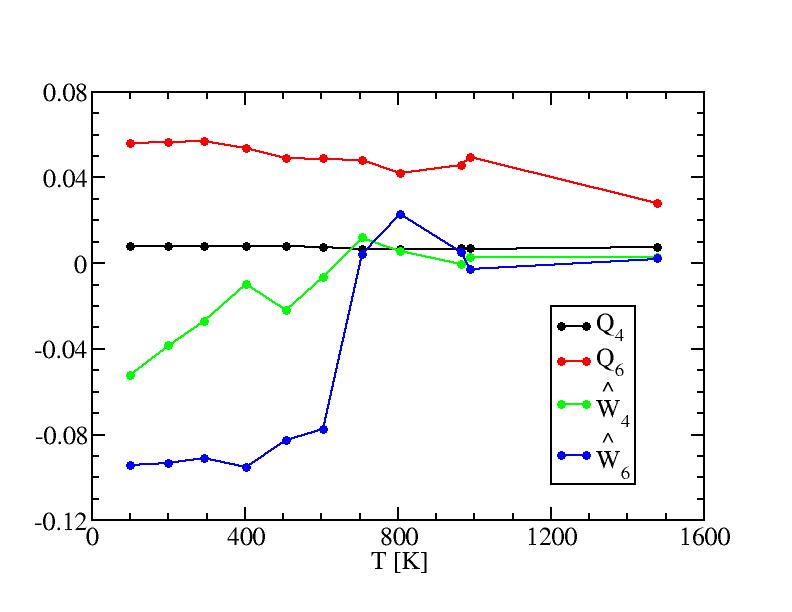
Bond order parameters of internal atoms

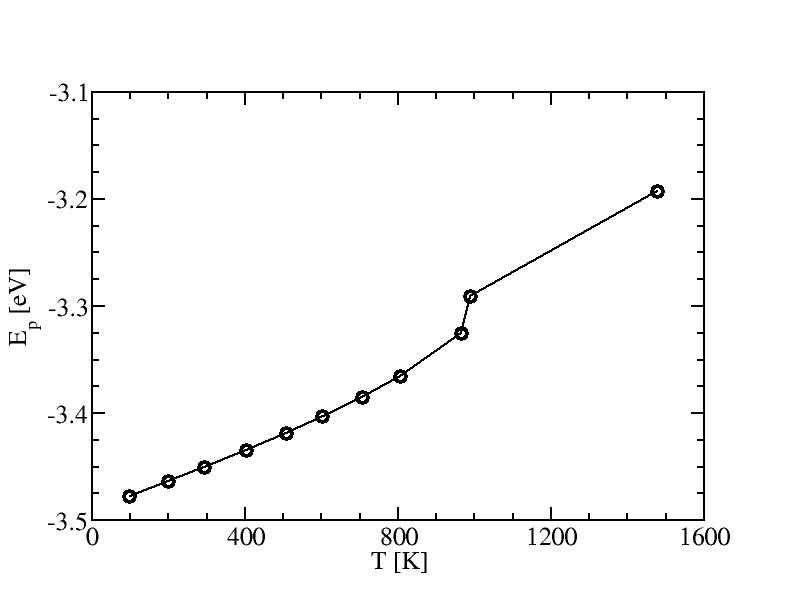
Caloric curve of potential energy
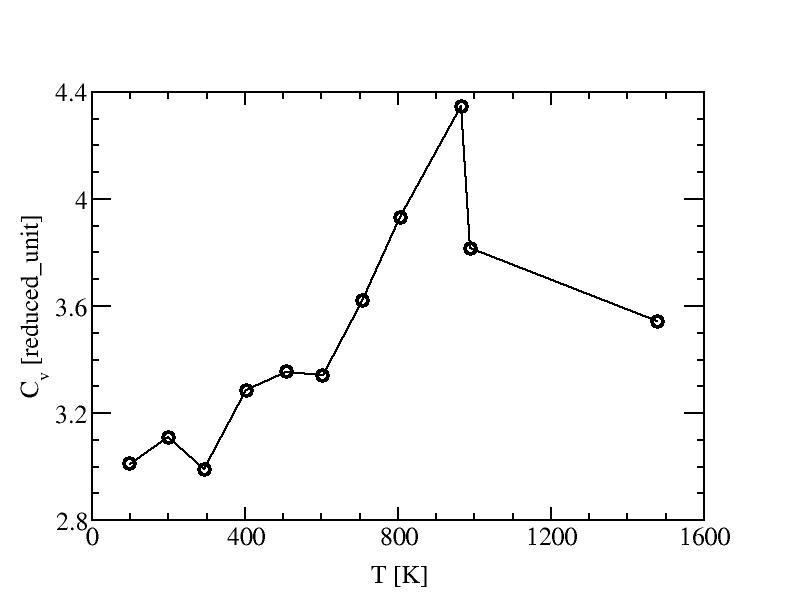
Specific heat capacity
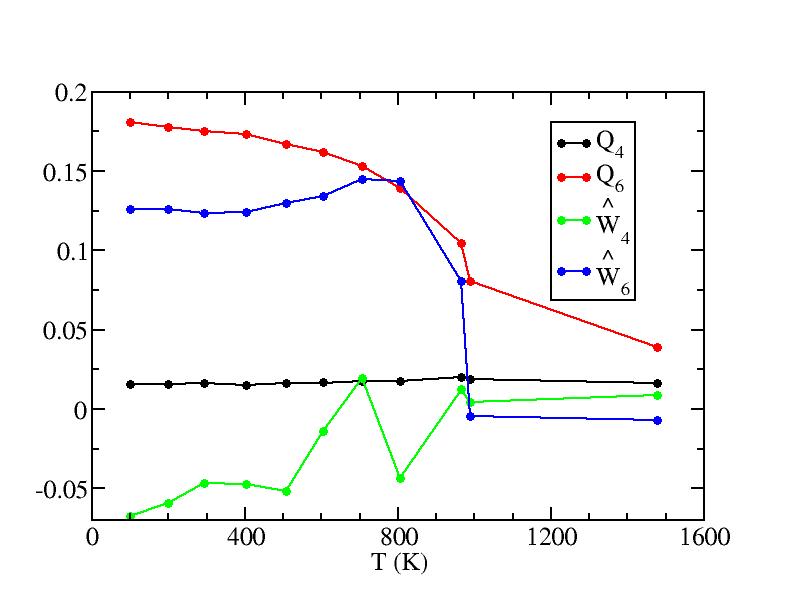
Average bond order parameters
Internal atoms
Surface atoms with nearest bulk atoms
Surface atoms only
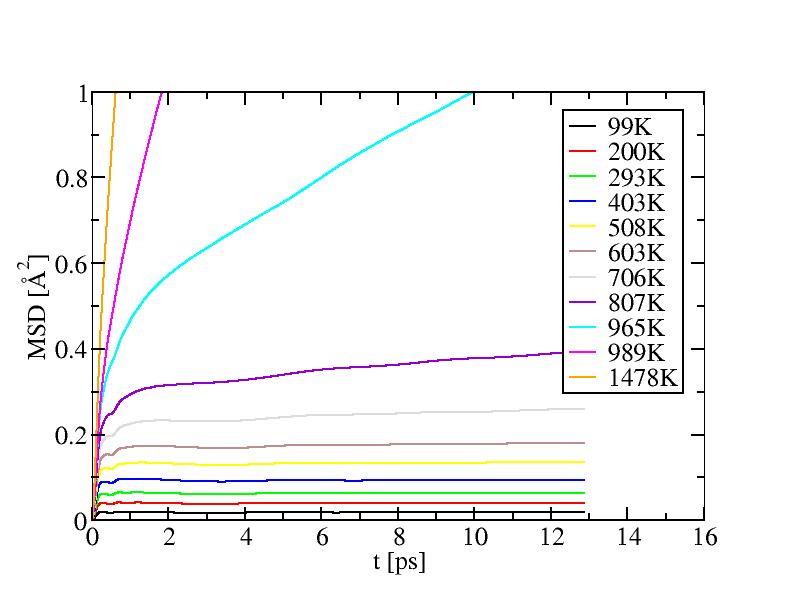
Diffusion coefficient
Mean square displacement of internal atoms
Mean square displacement of surface atoms
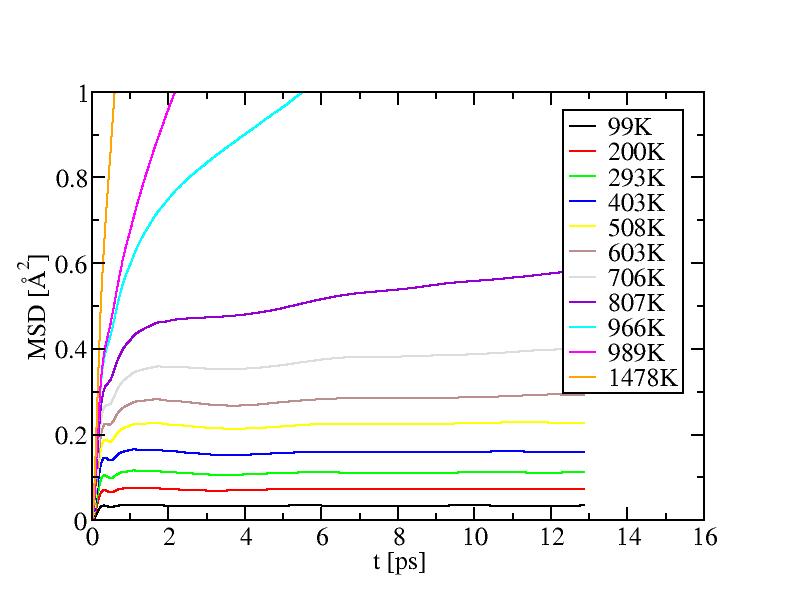
Diffusion coefficient
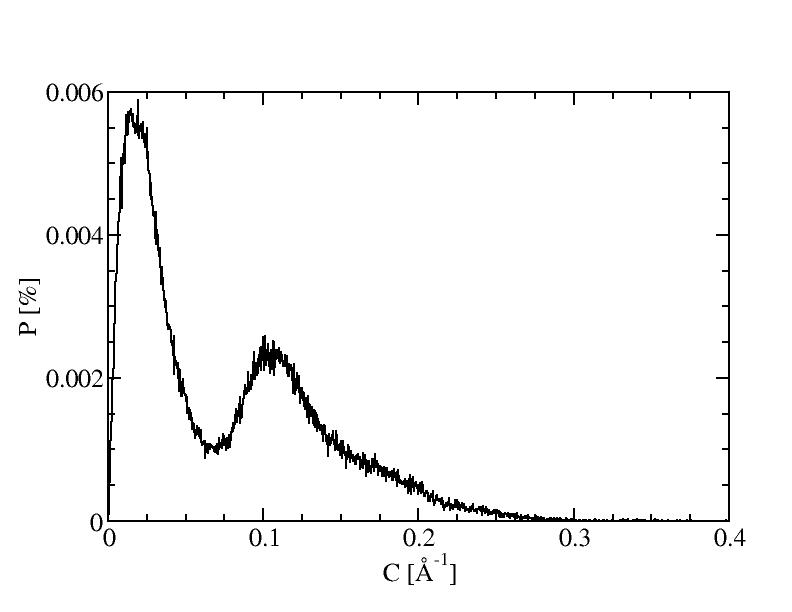
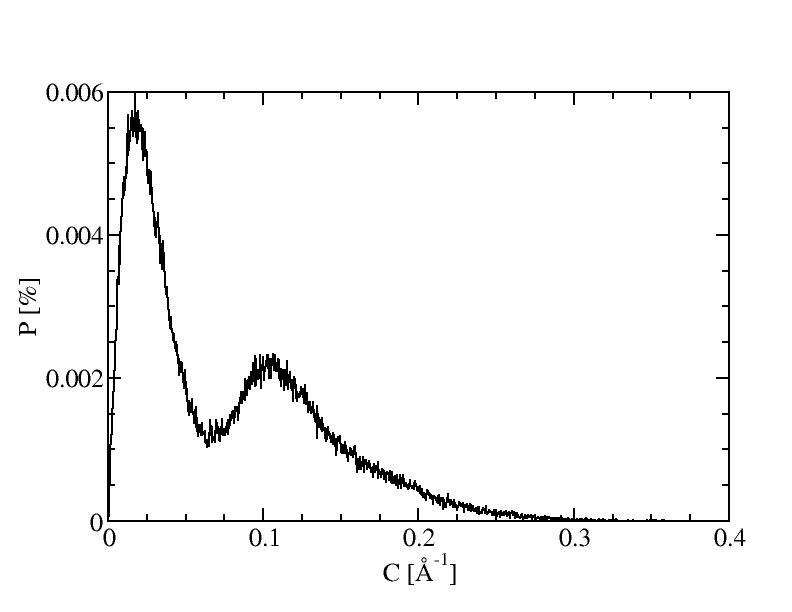
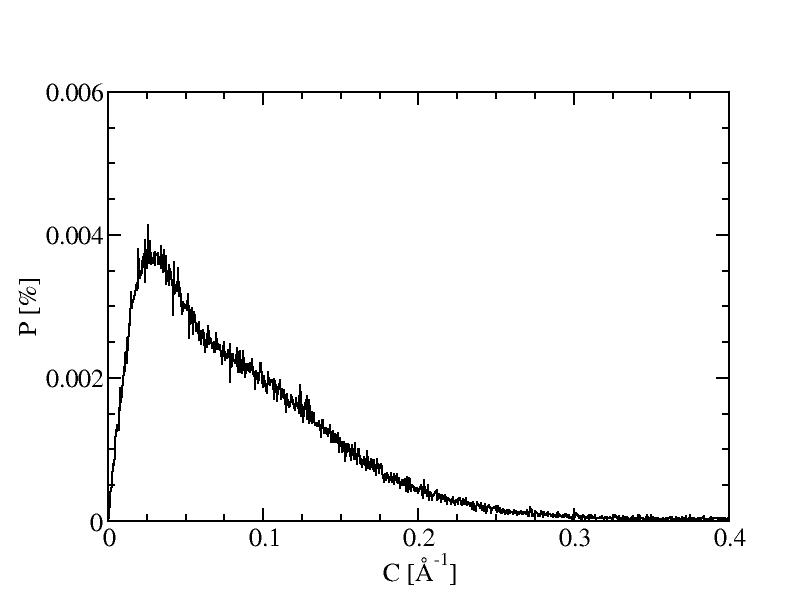
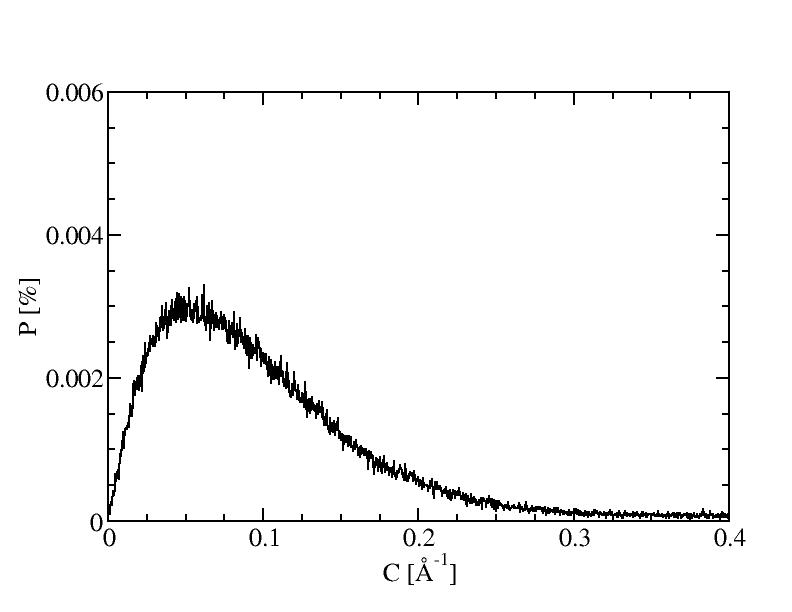
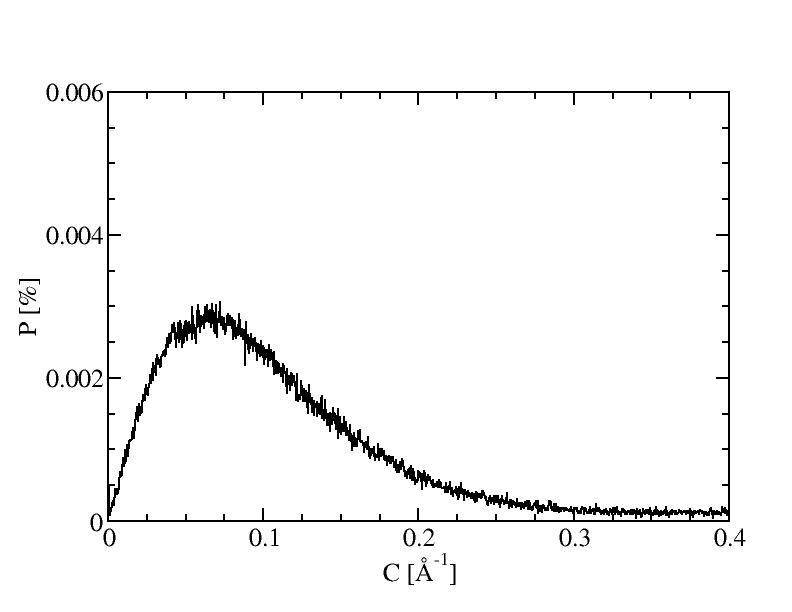
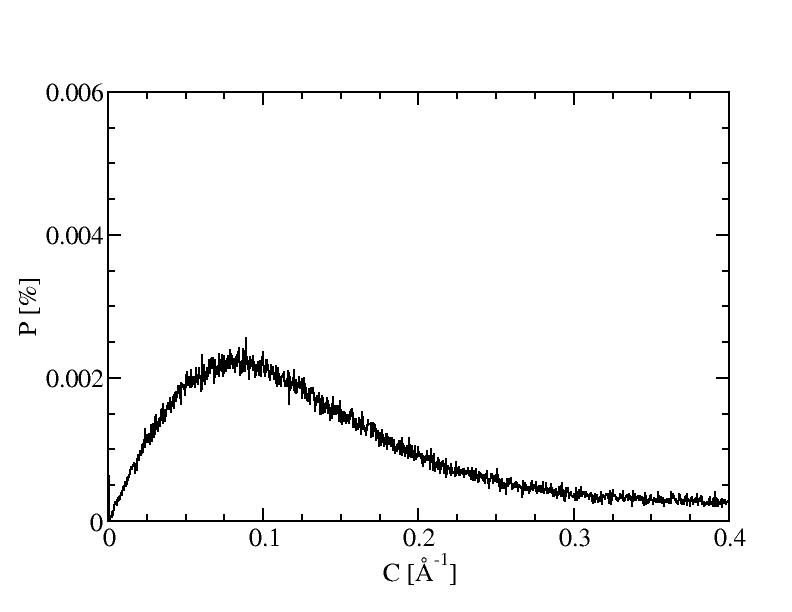
Curvature distributions
The histograms include 1000 bins.
Comparison of curvature distributions at 99K, 603K, 989K and 1478K
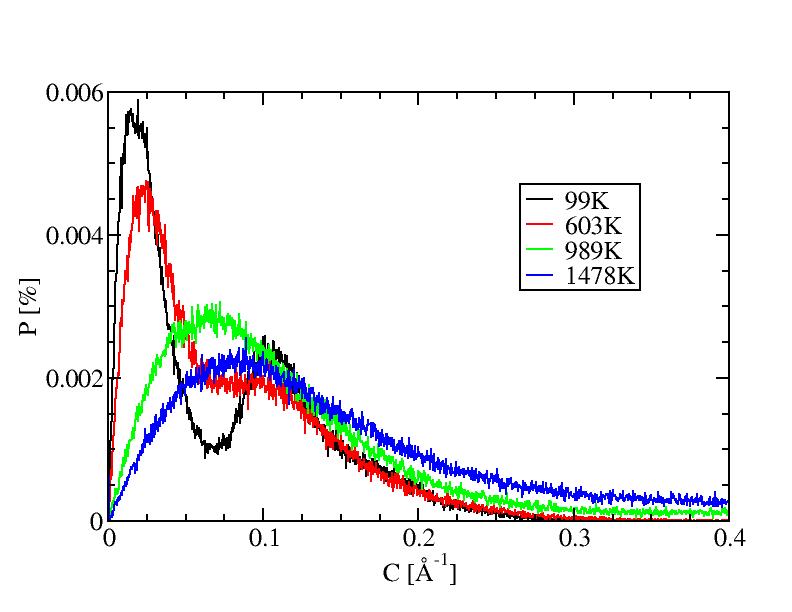
Curvature distributions at different temperatures
The data files of all temperature levels can be downloaded here
to achieve more comparisons on the same plot.
1) 99K
2) 200K
3) 293K
4) 403K

5) 508K
6) 603K
7) 706K
8) 807K
9) 966K
10) 989K
11) 1478K
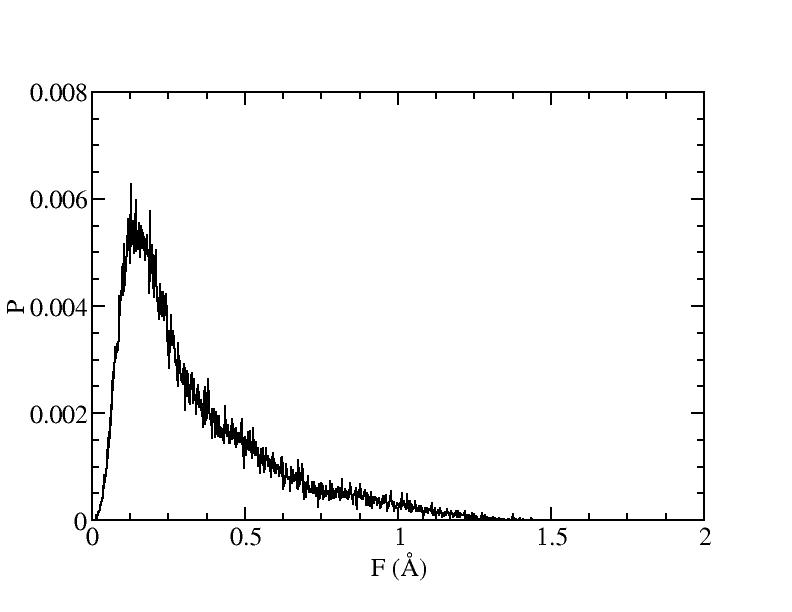
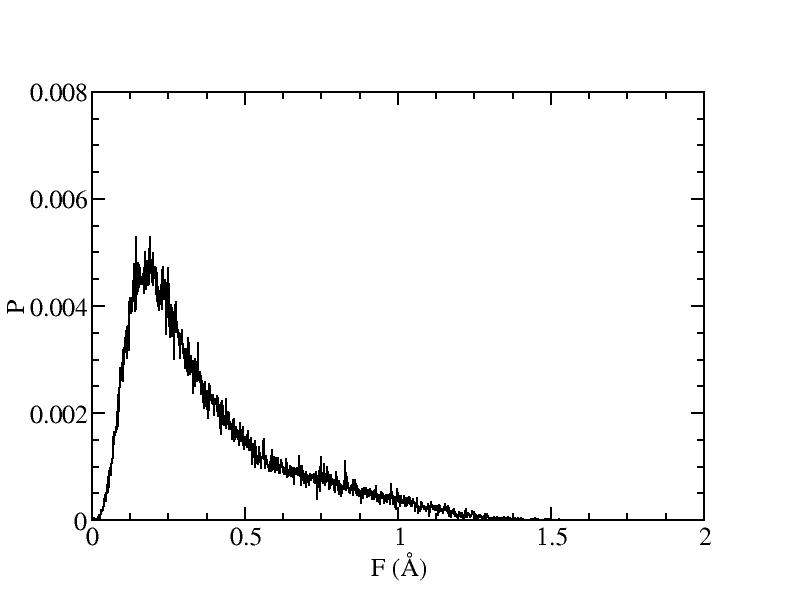
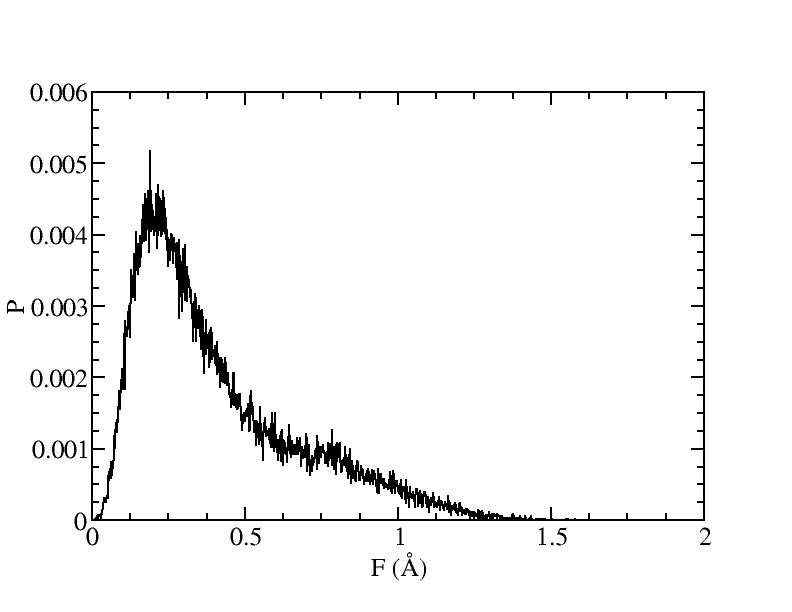
Flatness distributions
Curvature distributions at different temperatures
The data files of all temperature levels can be downloaded here
to achieve more comparisons on the same plot.
The values for F=0 are significant at temperature larger than 966K.
They are list below. That at 1478K is deleted from the histogram plot because
it's too large.
| T (K) |
99 |
200 |
293 |
403 |
508 |
603 |
706 |
807 |
966 |
989 |
1478 |
| P (F=0) |
0 |
0 |
0 |
0 |
0 |
0 |
0 |
1.81e-05 |
0.0016 |
0.0068 |
0.024 |
1) 99K
2) 200K
3) 293K
4) 403K
5) 508K
6) 603K
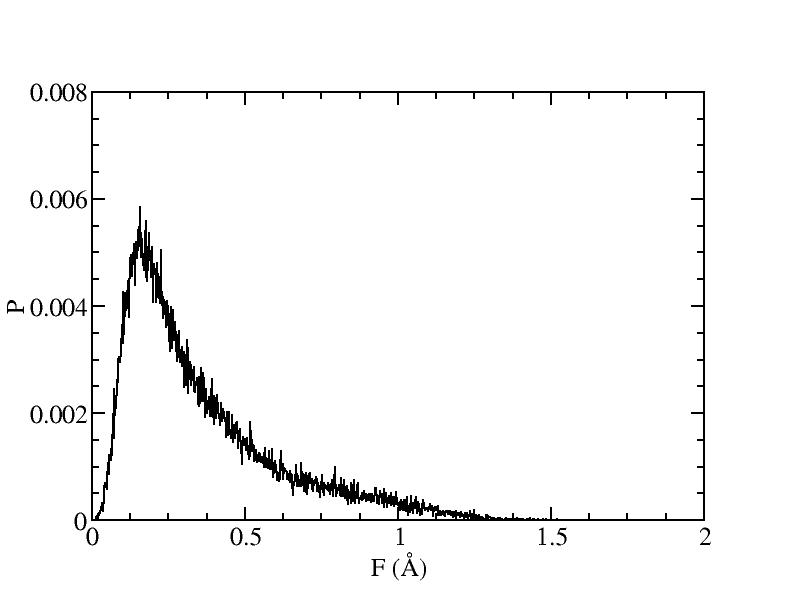
7) 706K
8) 807K
9) 966K
10) 989K
11) 1478K
Two-colored movies
The atoms in the first configuration are colored yellow if x<0 and green
if x>0. They can be downloaded here.