 |
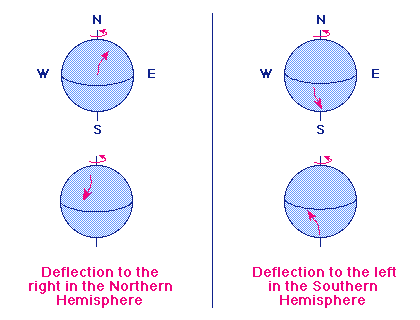
| The Coriolis force deflects to the right in the Northern hemisphere and to the left in the Southern hemisphere when viewed along the line of motion. |
The Earth is a spinning globe where a point at the equator is travelling at around 1100 km/hour, but a point at the poles is not moved by the rotation. This fact means that projectiles moving across the Earth's surface are subject to Coriolis forces that cause apparent deflection of the motion.
 |
| The Coriolis force deflects to the right in the Northern hemisphere and to the left in the Southern hemisphere when viewed along the line of motion. |
 Since winds are just molecules of air, they are also subject to Coriolis
forces. Winds are basically driven by Solar heating. As the adjacent
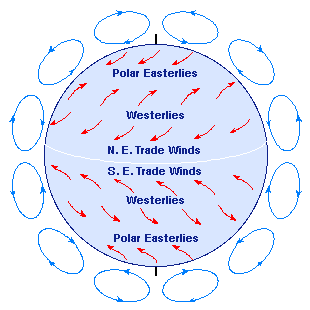
(highly idealized) image
indicates, Solar heating on the Earth has the effect of producing three major
convection zones in each hemisphere.
If solar heating were the only thing influencing the weather, we would then expect the prevailing winds along the Earth's surface to either be from the North or the South, depending on the latitude. However, the Coriolis force deflects these wind flows to the right in the Northern hemisphere and to the left in the Southern hemisphere. This produces the prevailing surface winds illustrated in the adjacent figure.
For
example, between 30 degrees and 60 degrees North latitude the solar convection
pattern would produce a prevailing surface wind from the South. However, the
Coriolis force deflects this flow to the right and the prevailing winds at
these latitudes are more from the West and Southwest. They are called the
prevailing Westerlies.
Realistic Weather Patterns
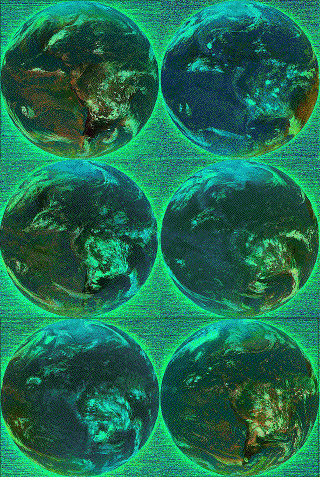
 The adjacent animation shows
GOES-8 weather satellite
images over a 72-hour period from Dec. 29, 1996, through Jan. 1, 1997. This is
a geosynchrous satellite, which means that it orbits the Earth with the same
period as the Earth's rotation and therefore appears to be essentially
motionless over a fixed position on the Earth's surface. For GOES-8 this fixed
position looks down on North and South America.
In these composite images red indicates visible light (reflected sunlight), green indicates the 11 micron IR channel (thermal emission), and blue indicates the 3.9 micron channel (thermal + sunlight). At night the images are blue and green. The three periods of daylight in this 72 hour sequence are clearly visible as red-orange regions moving from East to West (right to left). In the IR channels, the natural intensity pattern has been inverted: warmer is darker, so that cool cloudtops stand out brightly.
One can see clearly the pronounced cloud flows associated with the strong westerlies at mid-latitudes in each hemisphere. (This is taken in Northern hemisphere Winter, so the heavier cloud cover in that hemisphere is not surprising.) Less obvious are the easterly trade winds and the polar easterlies, though one can see vestiges of each if one looks carefully. Also apparent are the swirling motions associated with frontal systems. These are particularly pronounced at the boundaries between the mid-latitude westerly and polar wind flows in each hemisphere.
 |
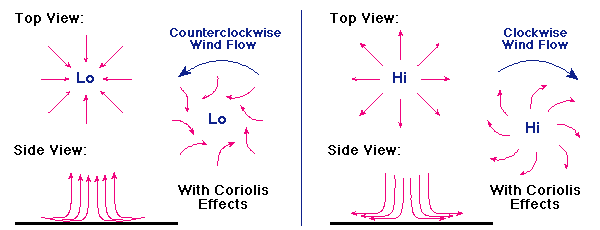
| Low pressure systems (left) and high pressure systems (right) in the Northern hemisphere |
Some hurricaine time series Credit: animations .