|
| The Solar Spectrum |
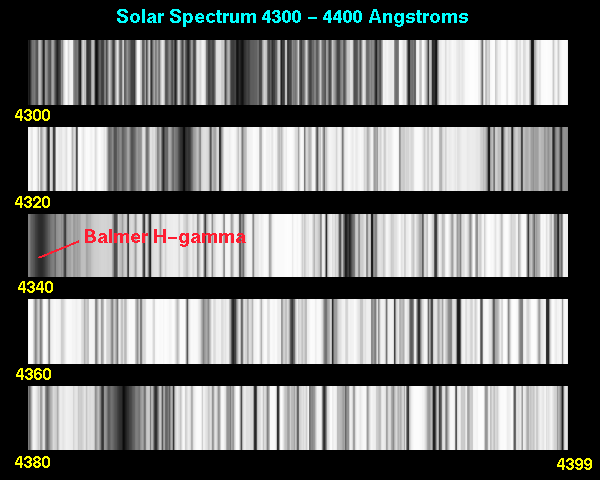
The solar spectrum consists of a continuum with thousands of dark absorption lines superposed. The lines are called the Frauenhofer lines, and the solar spectrum is sometimes called the Frauenhofer spectrum. These lines are produced primarily in the photosphere.

|
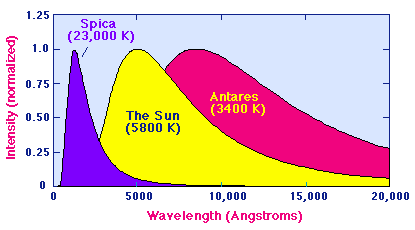
(Image constructed using data from BASS 2000 Solar Spectrum.) Here is the actual absorption spectrum for the region in the above image near the Balmer H-gamma line. The dark lines in the image above correspond to the strong dips seen in the light intensity in this spectrum. For example, note the strong dip near 4340 Å corresponding to the Balmer H-gamma line.
 |
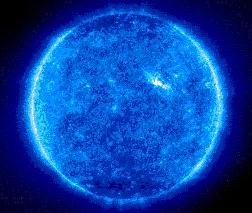
(Recall that the visible part of the spectrum extends from about 4000 Å up to about 7500 Å in wavelength.) The following false-color images show the Sun at X-Ray and UV wavelengths.
 |
 |
| The Sun at X-Ray wavelengths | The Sun at UV wavelengths |
The X-Ray image was taken in 1992 with the Yohkoh Soft X-ray Telescope (SXT). Since X-Rays are normally emitted from objects having temperatures of millions of degrees, this indicates that such hot spots occur in the Sun's upper atmosphere and corona. It is not completely understood why the Sun is producing the broad diffuse X-Ray glow seen in this image (more info). Here is the most recent Yohkoh image, and here is an MPEG movie (about 100 kB) of SXT observations for the last month.
The UV image was taken by the Solar and Heliospheric Observatory (SOHO). It is sensitive to the light emitted by highly charged iron ions at high temperature. In the image, lighter regions are at temperatures of about 1 million degrees, while darker regions are somewhat cooler (more info)