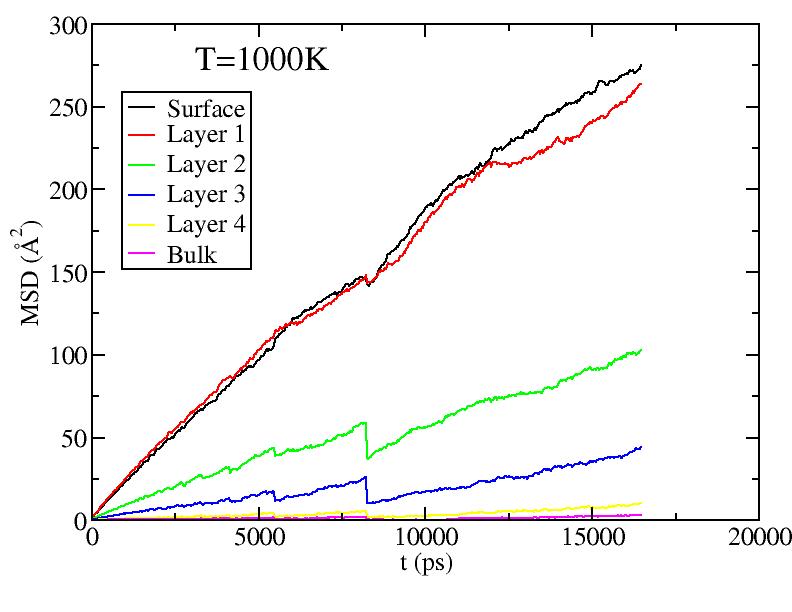
Since the steps still exist, it should not only because of the discontinuous simulations. In this MSD calculations we used only unovelaping independent data. When the number of MSD data changed (e.g. from 2 to 1 when the interval is half of the total number of configurations), the poor statistics may introduce a big step.
Calculations with overlaping intervals (minimum 10 values) got rid of the steps and gave smoother curves.
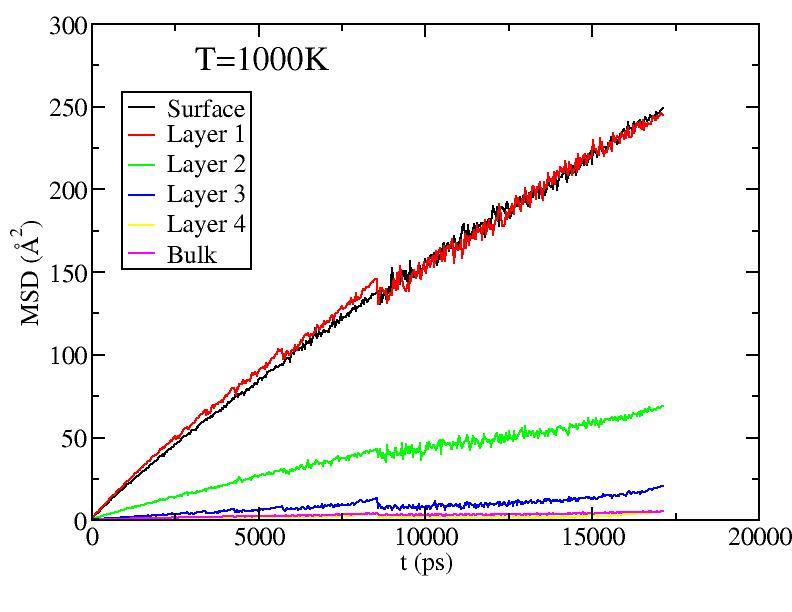
The results titled Shift are the independent calculations with random start points assigned to each atom (if possible).
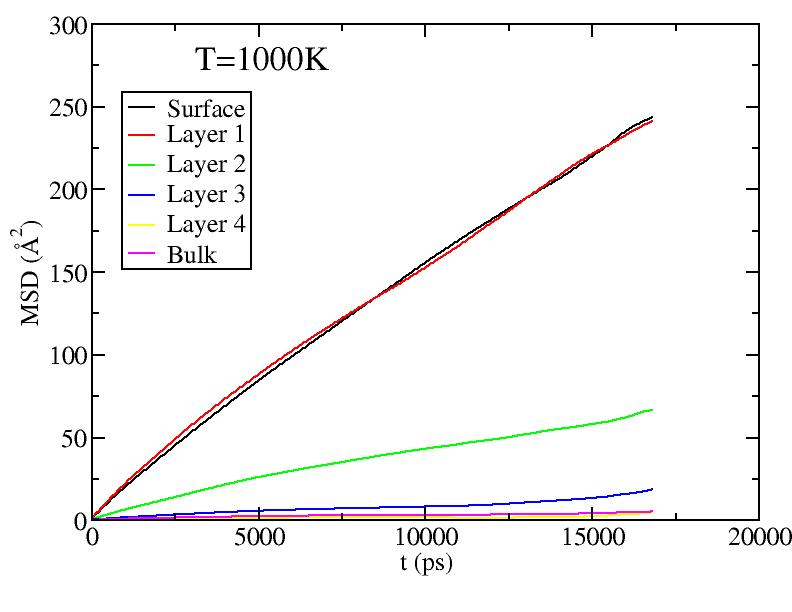
| Dependent | Independent | Shift |
|
|
|
|
|
|
|
|
|
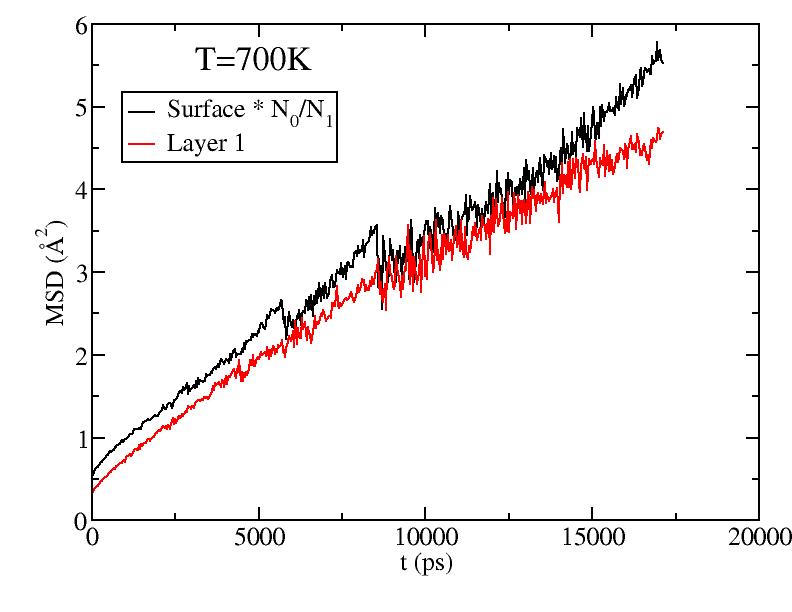
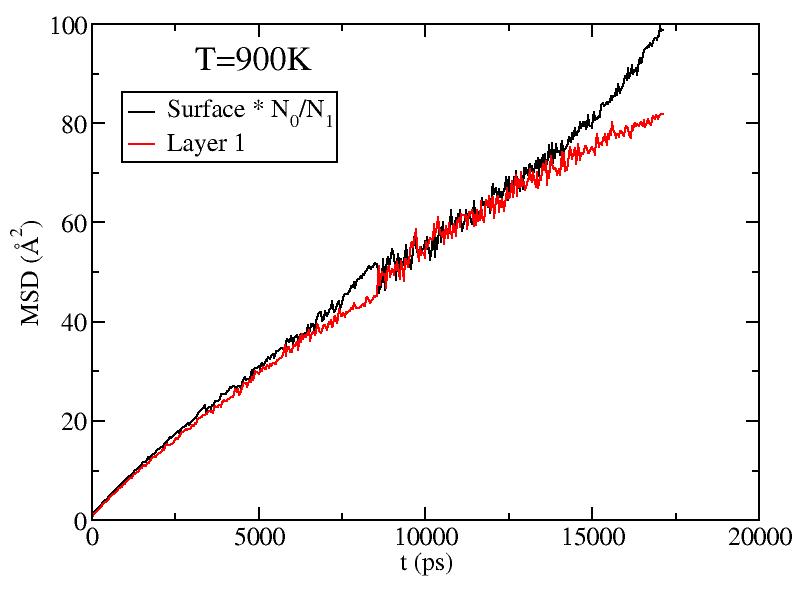
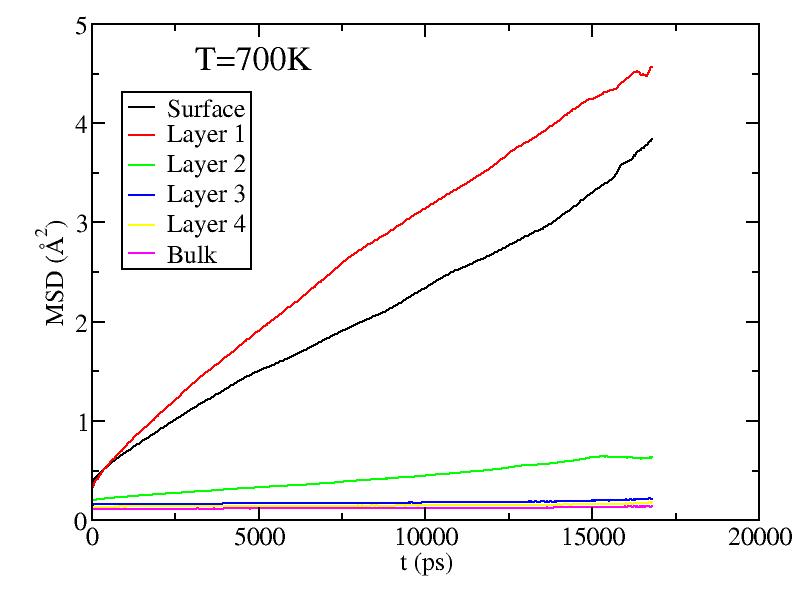
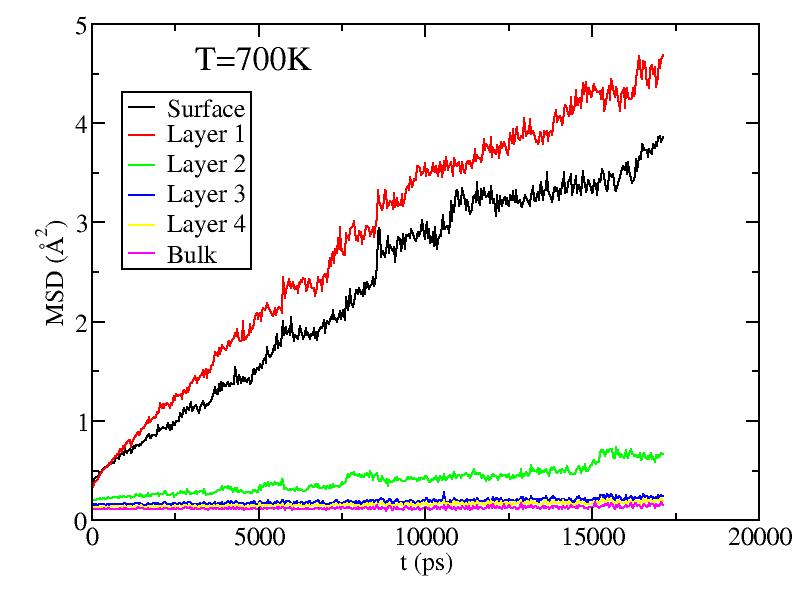
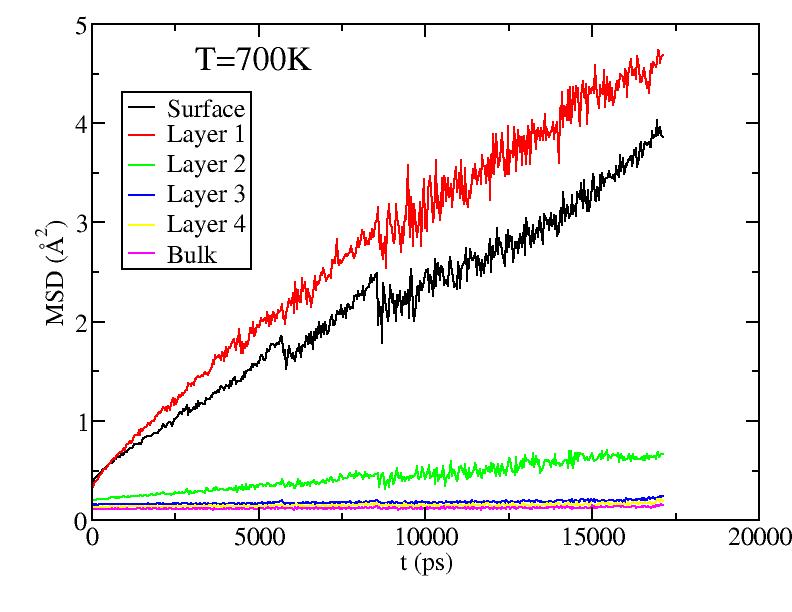
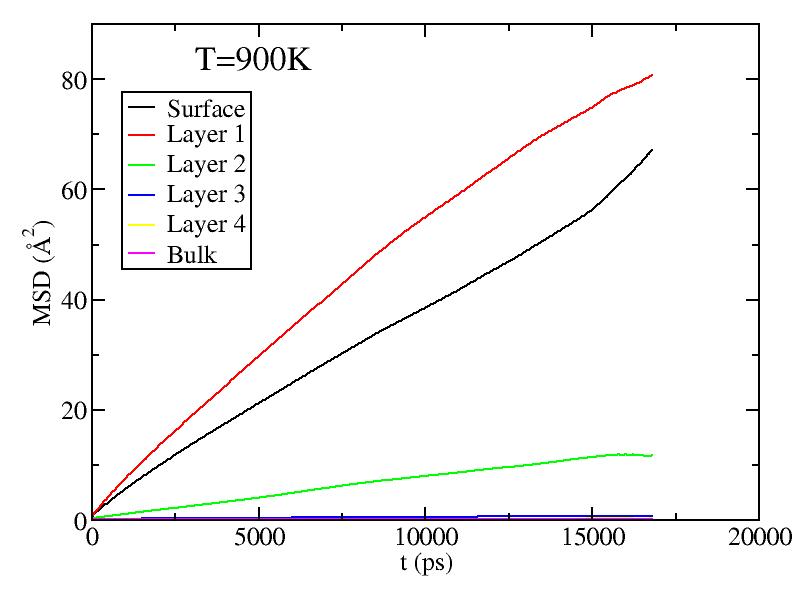
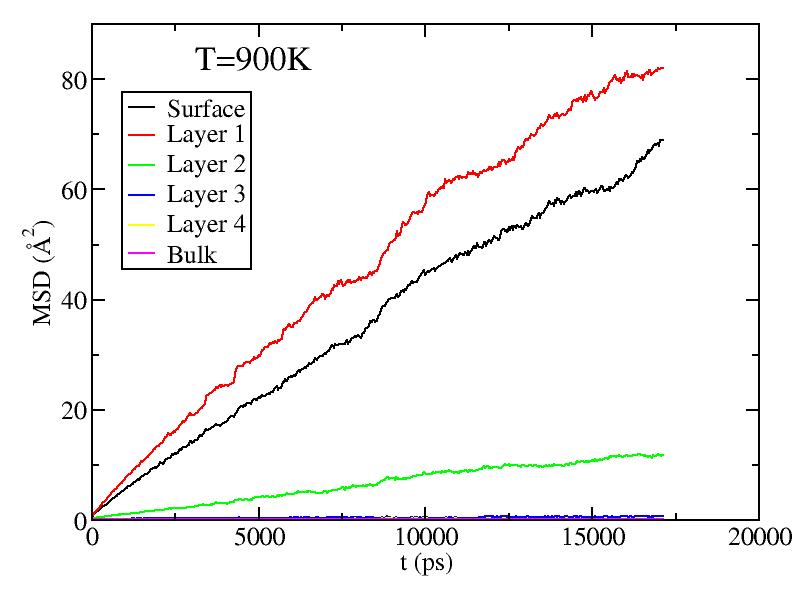
Let N0 be the number of atoms on the surface layer (=860), and N1 be that on the sub-surface layer (=600), and we redraw the average MSD of surface layer by a factor of N0 / N1 for T=700K and 900K. The following plots show that this problem was caused by averaging over all atoms, part of which do not diffuse.