December 16 2002
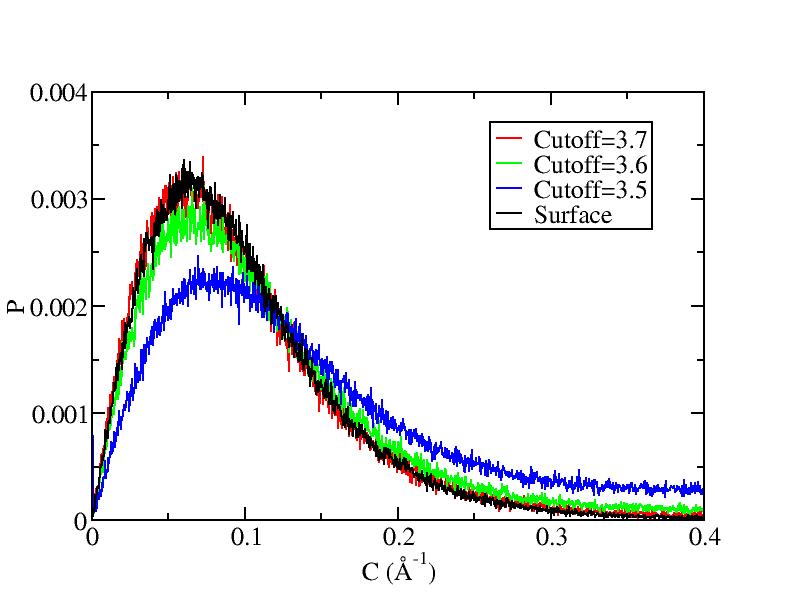
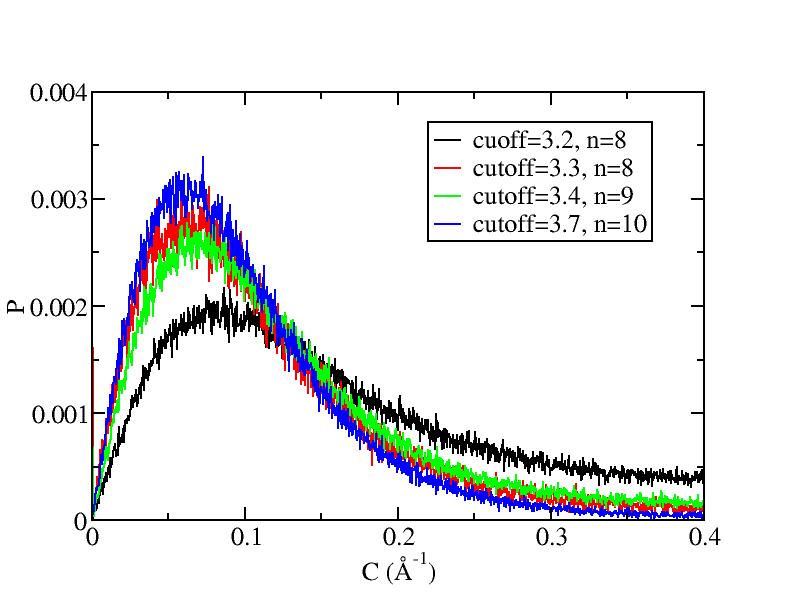
Enhanced surface discrimination method
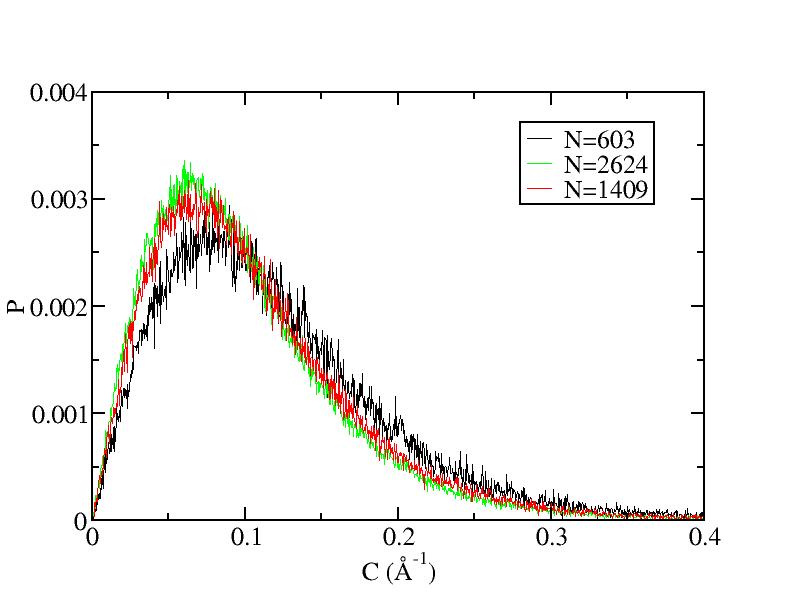
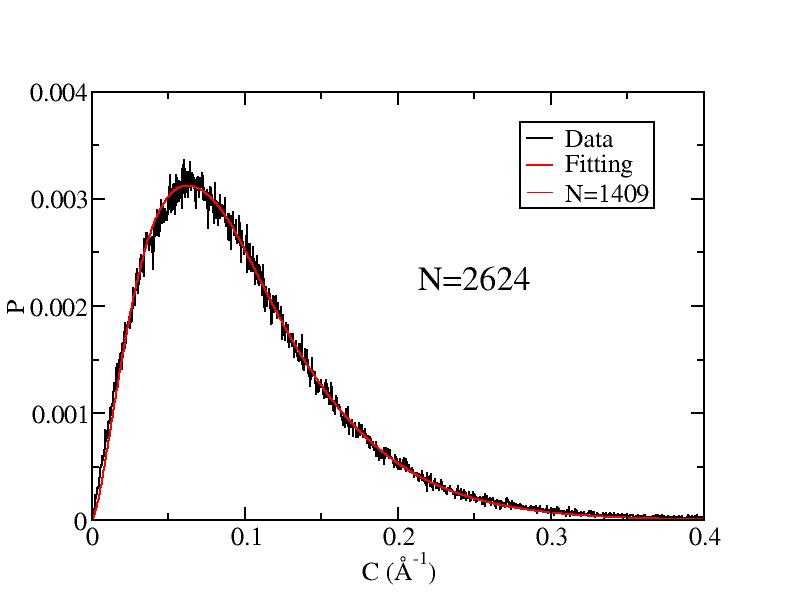
Comparison with previous method for 2624 atoms
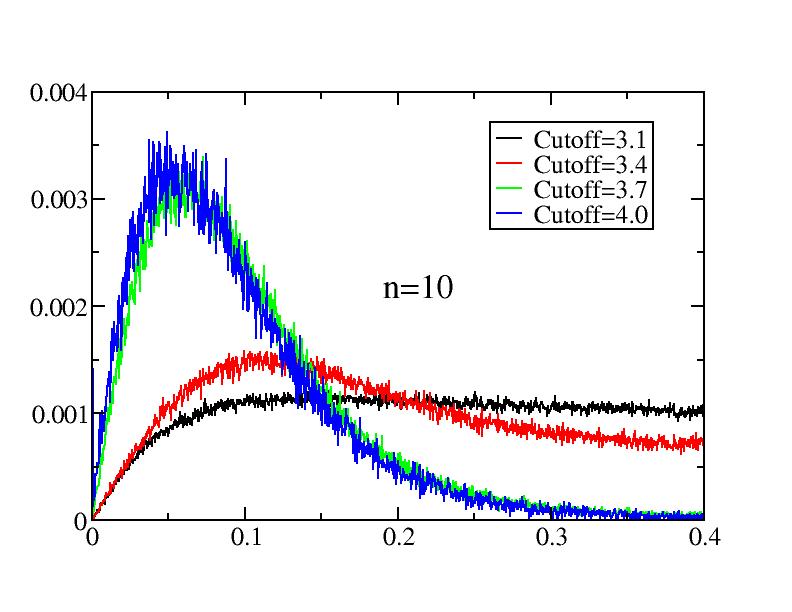
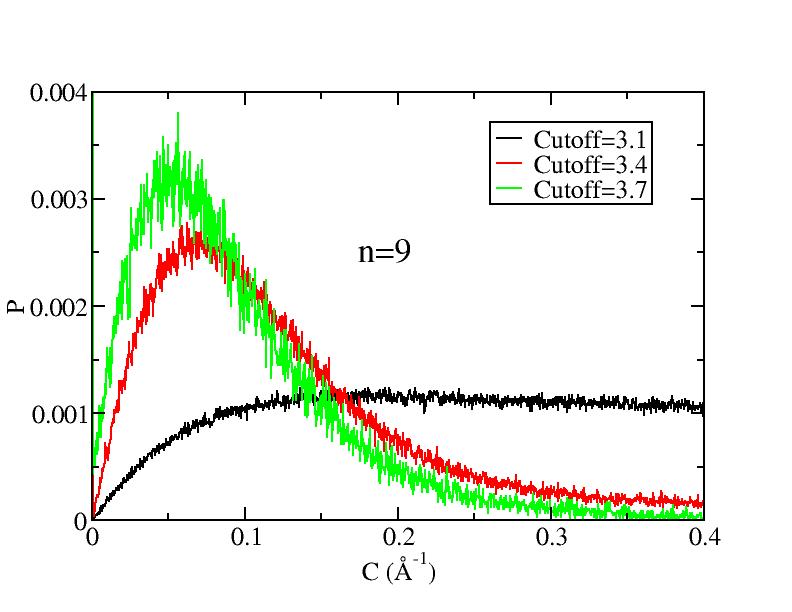
Curvature distribution at 1500K
Fitting at 1500K
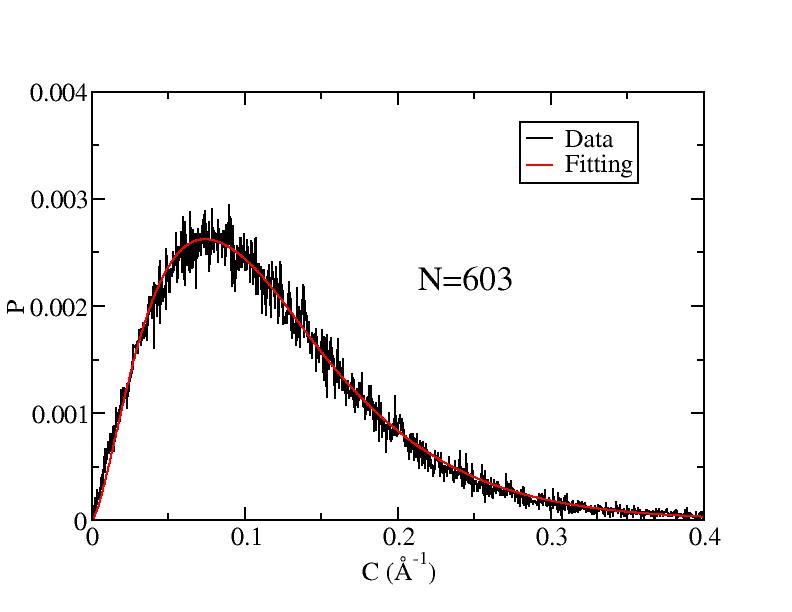
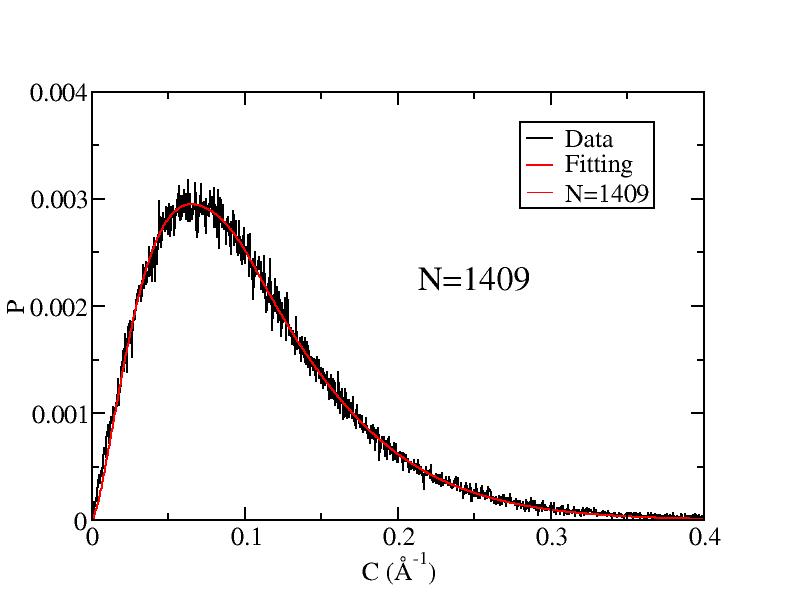
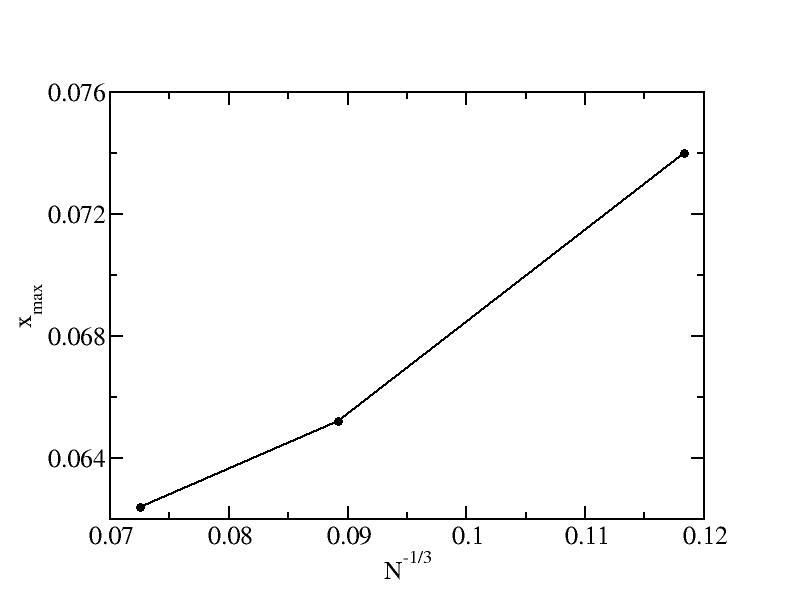
Peak value of the above three pictures:
| N |
N^(-1/3) |
Xmax |
| 603 |
0.118 |
0.074 |
| 1409 |
0.089 |
0.0652 |
| 2624 |
0.073 |
0.0624 |
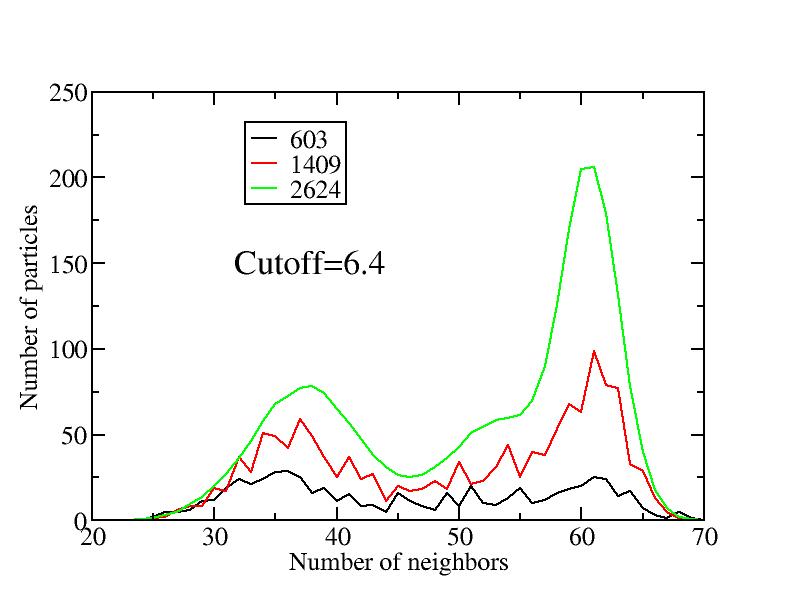
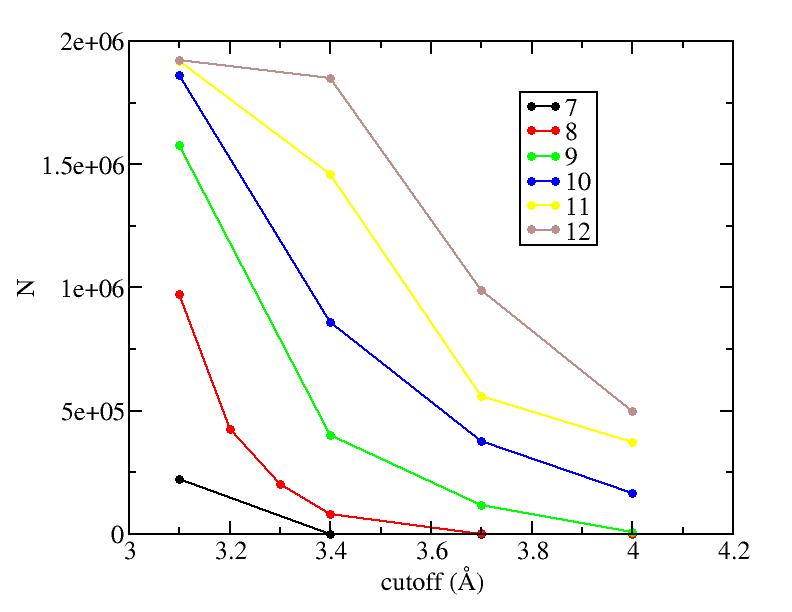
Comparison of different cutoffs and neighboring numbers with old method
Number of curvatures
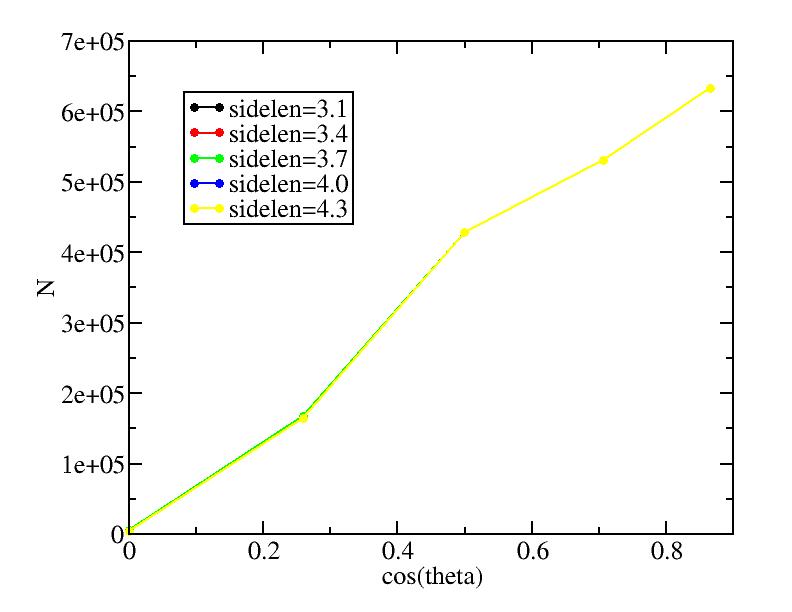
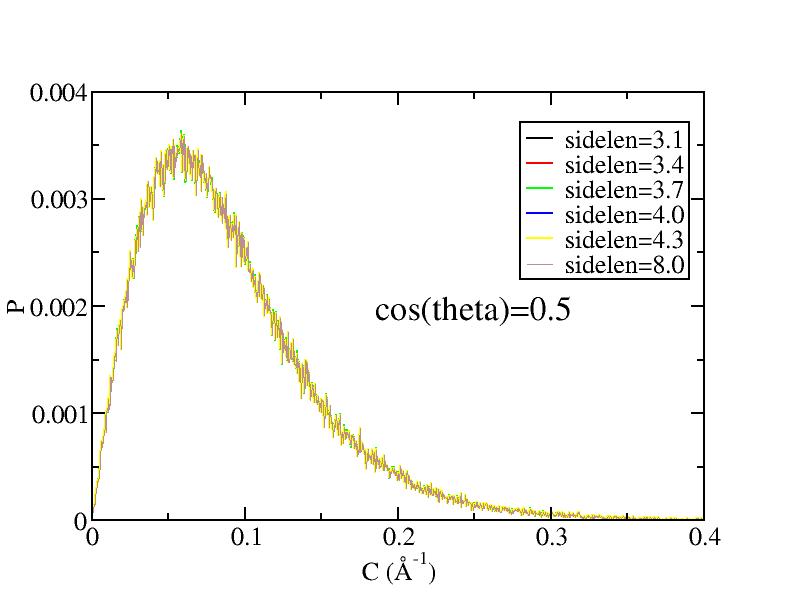
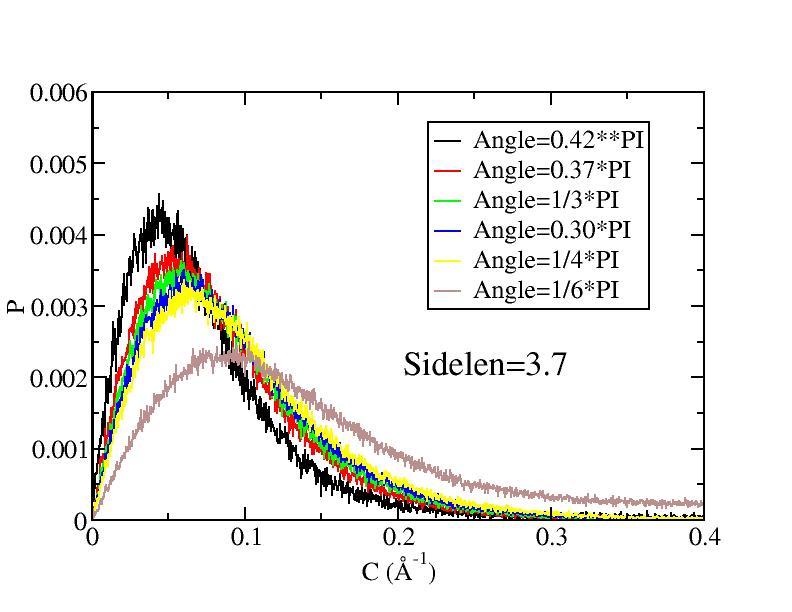
Comparison of different cell side length and angles with new method
Number of curvatures
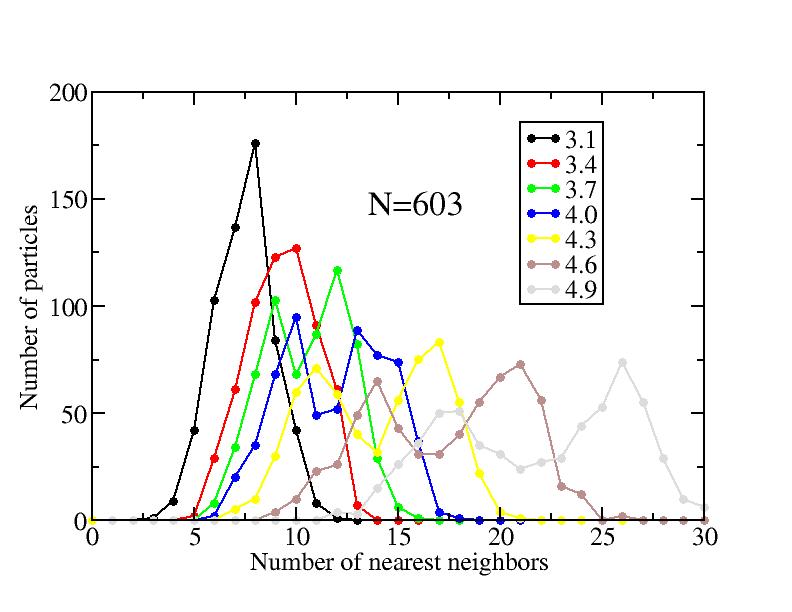
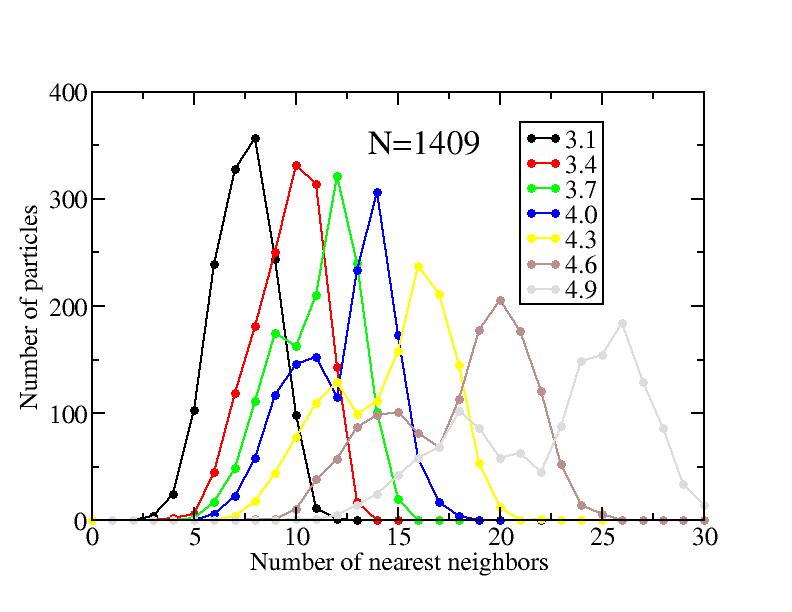
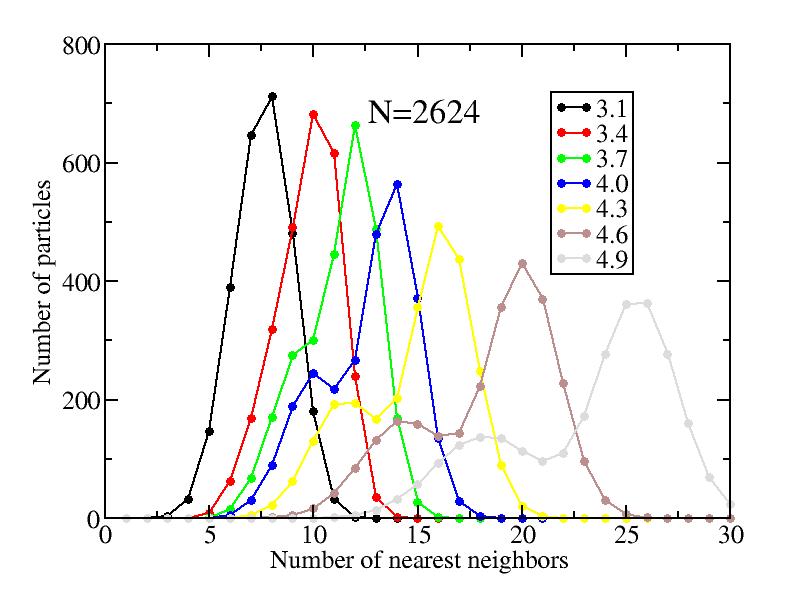
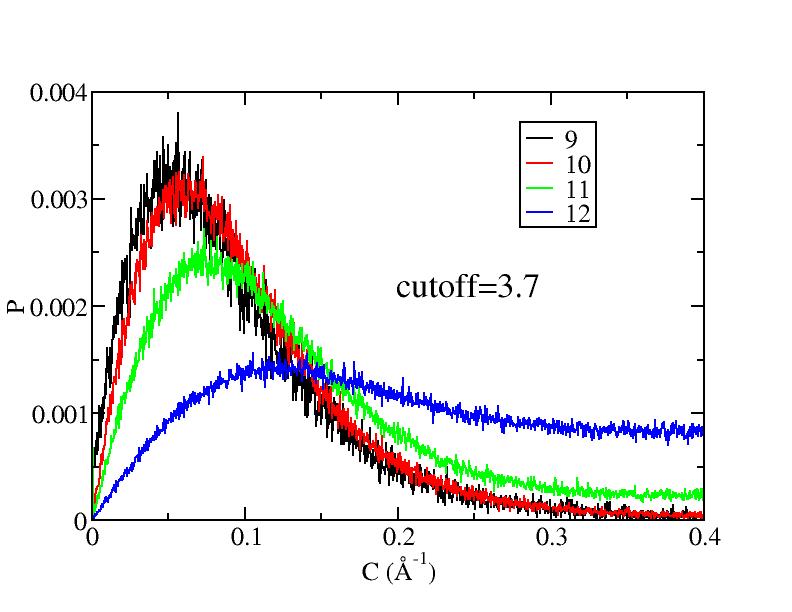
Histogram of the number of nearest neighbors with different cutoff