| |
Color Indices and
Surface Temperatures of a Star
|
The section on
Radiation Laws
indicated that there is a relationship between the
temperature of a blackbody and the location of the peak in the radiation
distribution as a function of wavelength
(Wien Law)
. This allows definition of
some continuous quantities called color indices that can be determined
directly from observations and that are indirect indicators of temperature for
a star.
Astronomical Color Filters
Optical devices called filters may be devised that allow light to
pass in a limited range of wavelengths. In astronomy, a variety of filters
are used to emphasize light in a particular wavelength region, but the most
common are called the U (ultraviolet), B (blue), and photovisual (V) filters.
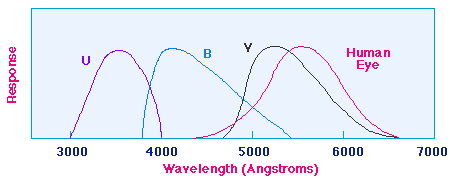
Their transmission of light as a function of wavelength, as well as
the response of the average human eye, is illustrated in the following figure.
 |
|
Response of standard astronomical filters and the human eye
|
The names for the filters arise because the peaks for transmission for the U,
B, and V filters are in the ultraviolet, blue, and yellow-green region of the
spectrum (the human eye is most sensitive to the yellow-green region of the
visible-light spectrum). Thus, astronomers can measure the intensity of light
from a source like a star in each of these regions of the spectrum by passing
the light collected by the telescope through the appropriate filter.
Temperatures and Radiation Distributions
From the
Planck Law
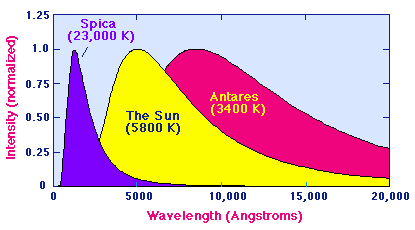
radiation distributions illustrated below for several
stars of differing surface temperatures, we
see that generally the intensity of light from a star of given temperature will
not be the same in the U, B, and V regions.
(Note that for convenience in plotting
these distributions have been normalized to unity at the respective
peaks; by the Stefan-Boltzmann Law, the area under the peak for the hot star
Spica is in reality
2094 times the area under the peak for the cool star Antares.)
Color Indices
A color index is defined by taking the difference in
magnitudes (which
are related logarithmically to intensity) at two different wavelengths. Using
the U, B, and V color filters, there are three independent possible such
differences. For example, the B-V color index is defined by taking the difference
between the magnitudes in the blue and visual regions of the spectrum and the U-B
color index is the analogous difference between the UV and blue regions of the
spectrum.
Color Index Examples
The star Spica has apparent magnitudes U = -0.24, B = 0.7, and V
= 0.9
in the UV, blue, and photovisual regions, respectively. The corresponding color
indices are
B - V = 0.7 - 0.9 = - 0.2
U - B = -0.24 -0.7 = - 0.94
Generally, the negative values of these color indices are an indication that Spica
is a hot star, with most of its radiation coming at shorter wavelengths.
On the other hand, for Antares B = 2.7 and V=0.9, and the B - V color index is
B - V = 2.7 - 0.9 = 1.8
The positive value of B - V in this case is an indication that Antares is a cool
star, with most of its radiation coming at longer wavelengths.


